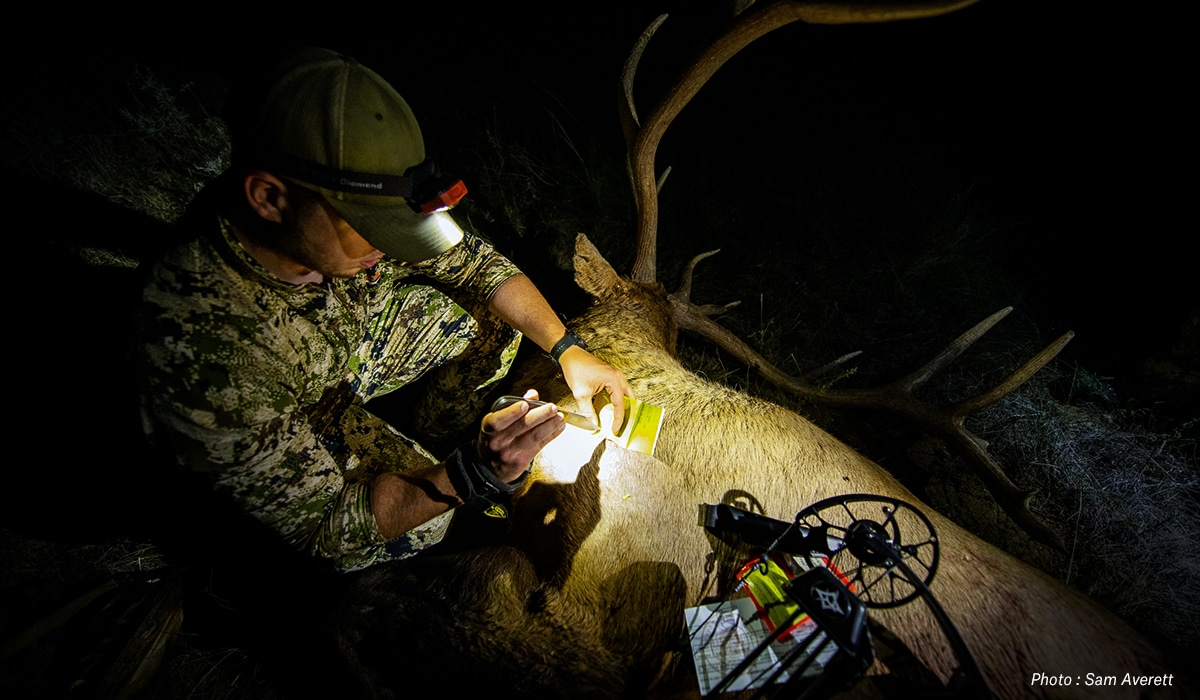
Understanding basic concepts and having access to the right resources are key to unlocking your next hunt experience.
There is nothing quite like the excitement of packing up your gear, loading the vehicle, and hitting the road for a hunt away from home. Perhaps it is the change of landscape, the challenge of chasing a different species, or simply just the anticipation of memories made. Regardless, there’s always something special about new pursuits.
Often, however, these new hunting opportunities have a different requirement attached: applying for tags that are issued via a drawing.
If you’re new to the application season game, understanding each state’s procedures and terminology may feel a bit overwhelming at first. There can be a lot to remember, and even the experienced can need a reminder about how something works in a particular state. It may seem like an overwhelming amount of information to digest, but a general understanding of just three basic concepts is all that’s needed for you to create a smart application strategy: point systems, draw procedures/tag allocations, and draw odds.
Point Systems
Simply put, point systems are a method that some states use to increase your chances of drawing a tag over time.
You acquire points annually and by species (elk, deer, etc.), to be used for your future applications. You get a new point when either:
A) You apply for a species and are unsuccessful in drawing a tag
or
B) You have specifically applied for “points only” given a particular species
For each species, you are awarded another point by either A or B in a given year, but not both. You lose your points for a species when you draw successfully for that species, or if you stop applying all together for consecutive years, your points can expire.
There are two distinct types of points, and they fundamentally increase your chances to draw in a different way:
1) Preference points are used like a place in a line. If you have three points and I have two, you’re in line ahead of me and will draw before I do if we both apply for the same hunt. In general, think of preference points as “first in, first out.”
2) Bonus points are like raffle tickets. The more bonus points you have, the greater the chances that you will be successful. If you have 10 bonus points and I have three, I can still draw a specific hunt before you if my “number” is drawn.
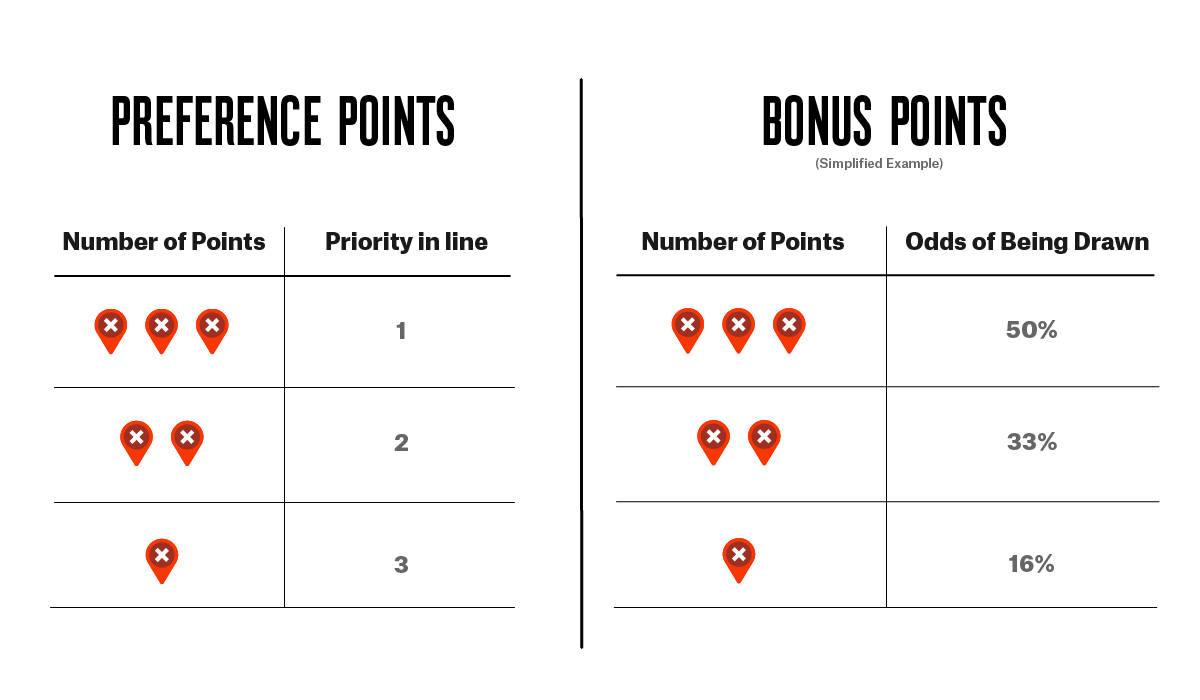
With bonus points, there are some states that will mathematically square your total to give you that many more chances in the drawing (Montana and Nevada, for example). So if you have three bonus points in Nevada, you’ll get nine (three times three) extra “chances” to draw. This method gives more of a mathematical advantage to the applicants with the most bonus points, but still does not guarantee success for high point holders.
Not every state uses a point system. New Mexico and Idaho are good examples where hunt tag drawings are completely random. In a random drawing, every applicant—regardless of how long they have been applying for—has the same chance to draw for a given hunt as every other applicant in their pool (resident and nonresident “pools,” for example).
Tag Allocations/Drawing Procedures
Regardless of a particular state’s point system, the overall “randomness” of their drawing is the next important thing to understand. On a three-step scale of randomness, we have: 1) least random (preference point rules), 2) random but with extra weight for longevity (bonus point rules), and 3) completely random.
Some states take a hybrid approach when allocating tags in the drawing. They divide the total number of available tags for a given hunt and issue some of these tags differently with respect to our three-step random scale.
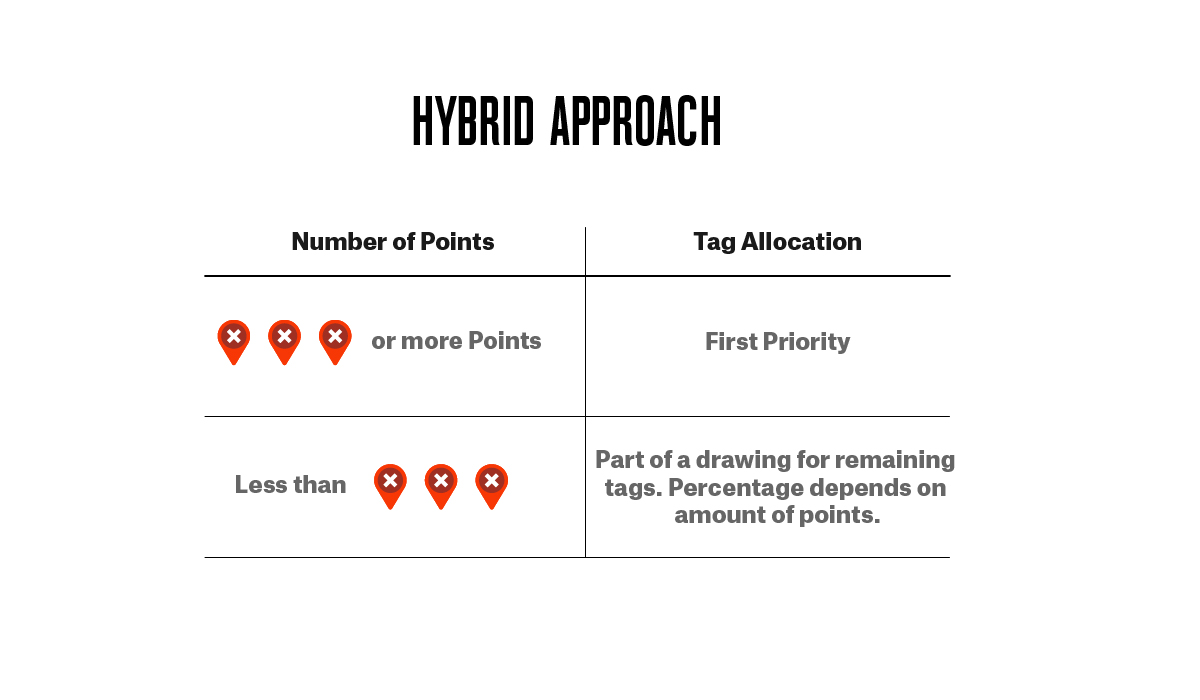
Arizona is a good example of this. Traditionally, you will see Arizona referred to as a bonus point state, but in reality, it has a hybrid approach. For every individual hunt code, 20% of the total number of tags for each hunt will be awarded to the applicants with the most bonus points. So for that 20% of the tags, they are effectively going to treat your bonus points as preference points (your place in line). And then the remaining 80% of the tags will be issued in a random drawing according to traditional bonus point rules (raffle ticket drawing).
Arizona’s approach makes it a slightly less random drawing overall, but also gives the applicants with higher point totals another path to drawing successfully. And that is exactly what hybrid tag allocations are attempting to do: distribute chances so that there is some appeal to all applicants regardless of point total.
In general, however, if you are a new applicant or just recently started applying and have few points, more random is better.
The other important aspect of each state’s drawing procedure is how they evaluate the hunt choices on your application. Most states will allow you to apply for more than one hunt per species, but the manner in which they evaluate those choices can vary by state.
Some will only evaluate your first choice before moving on to the next application, and second, third, and fourth choices are only possible to draw after everyone’s first choice has been considered. In these cases, your only hope to draw with second choice and beyond is for hunts in lower demand (antlerless opportunities, for example).
However, in other states, they will evaluate multiple choices on your application before moving on. In Nevada, for example, your first five hunt choices are evaluated before advancing to the next application in the drawing. This has an impact on drawing odds, and therefore in these states, your application strategy will be different. How you use your choices in this scenario requires a little more thought than simply choosing a single hunt per species.
In addition, each state’s draw procedures will also define how group applications are evaluated with respect to the point totals of each member of the group. In some cases, applying as a group can reduce your overall chances, while in other instances it can actually be used to your individual advantage.
Draw Odds
Applying for draw hunts on an annual basis is a costly endeavor, so having a reasonable plan that meets both your own personal hunt goals and budget is important. The biggest key to realistic expectations is understanding what your real chances of drawing are when you apply.
Calculating actual draw odds can be complex when you factor in all of the details above. In some instances, the only way to do it with good accuracy is via computer simulation—and with actual applicant data from the respective state wildlife agencies.
Put It All Together: onX Hunt Research Tools
Once you have a general understanding of these key concepts, you’re ready to start planning and researching your next hunt application.
Hunt Research Tools is an online tool that provides the most accurate draw odds in the industry for 11 key western states. The information includes hunt quotas, applicant totals, harvest information, and other big game unit statistics.