If you’ve ever applied for an elk tag in the West, you know it isn’t a sure bet. Even if you’re a resident, landing coveted tags in quality units can be challenging.
Anecdotally, many hunters have observed that tags in the West were becoming increasingly difficult to draw. onX Hunt wanted to know why. To help find out, we analyzed elk application data from 2018-2022 in eight Western states.
The data revealed hunter frustrations around increased tag demand are very real.
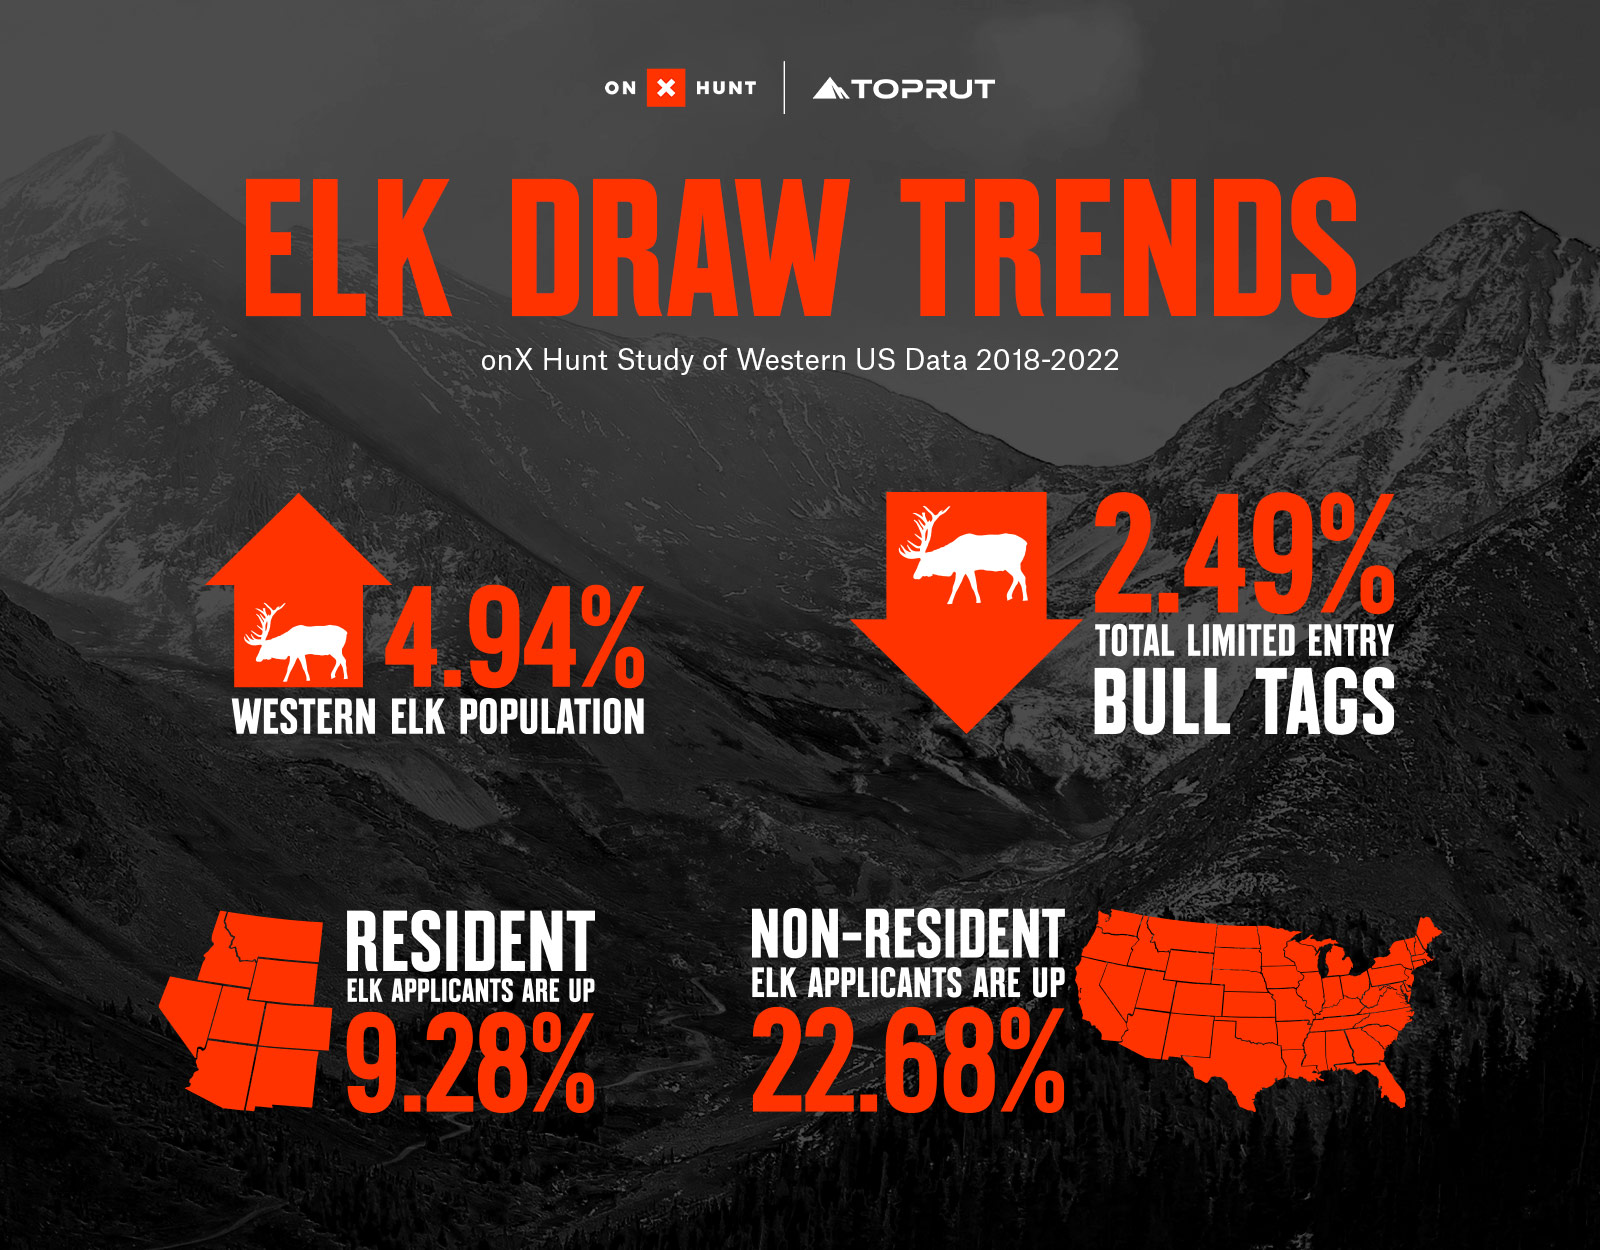
Western Elk Applicants Are Steadily Rising
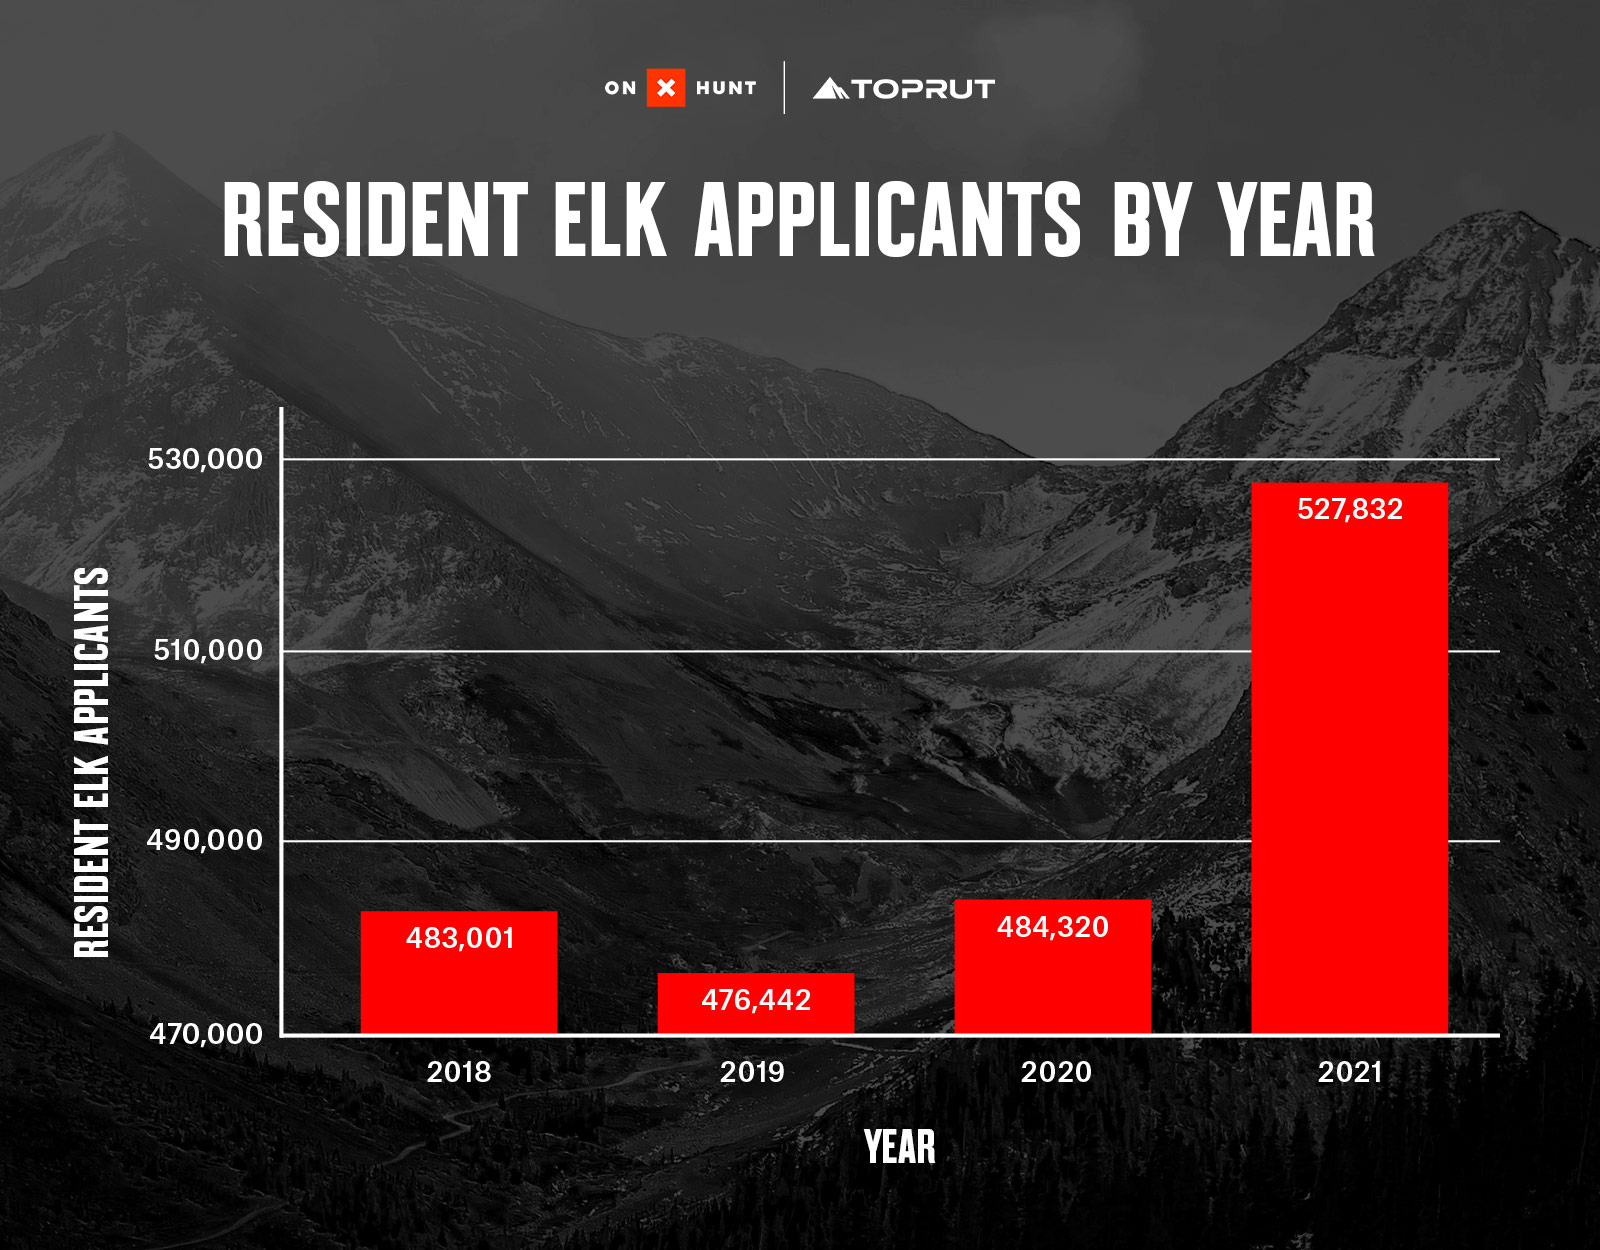
- Resident elk applicants are up +9.28% from 2018 to 2021.
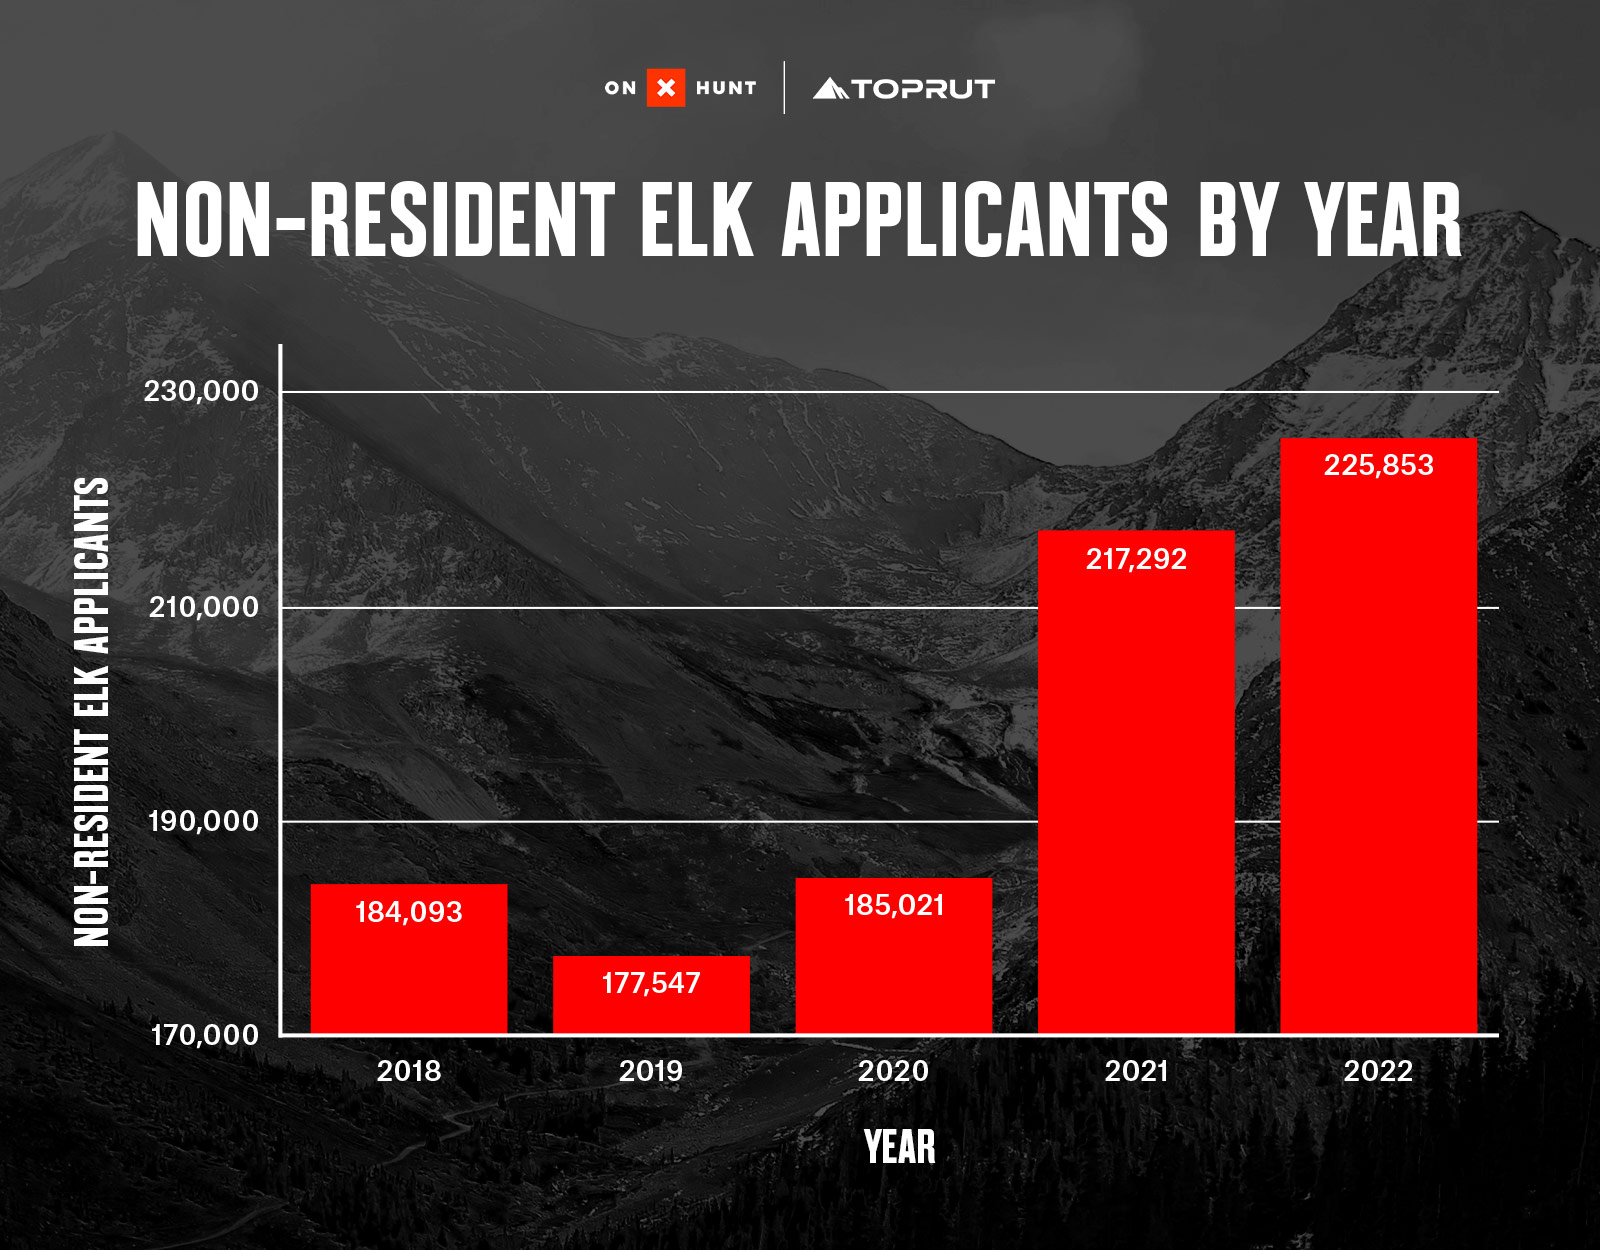
- Non-resident elk applicants are up +22.68% over the past five years.
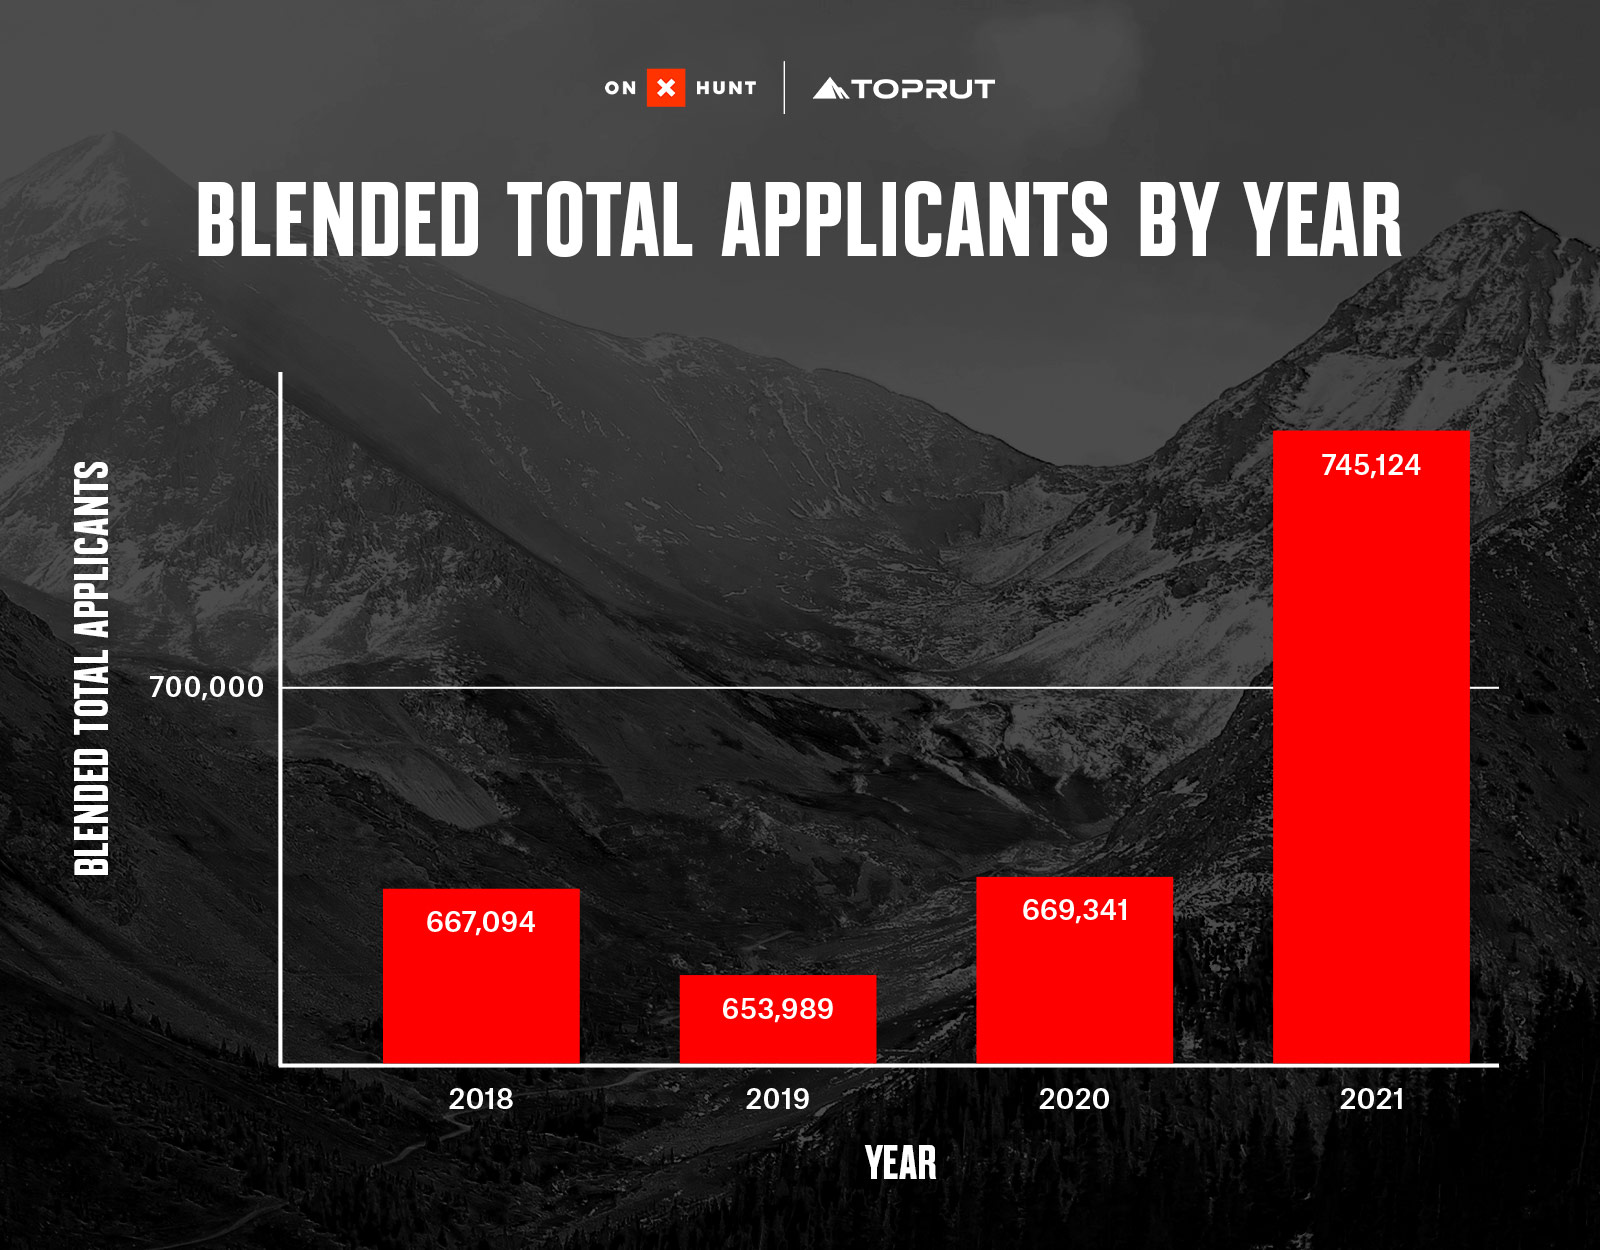
- Blended total applicants are up +11.70% from 2018 to 2021.
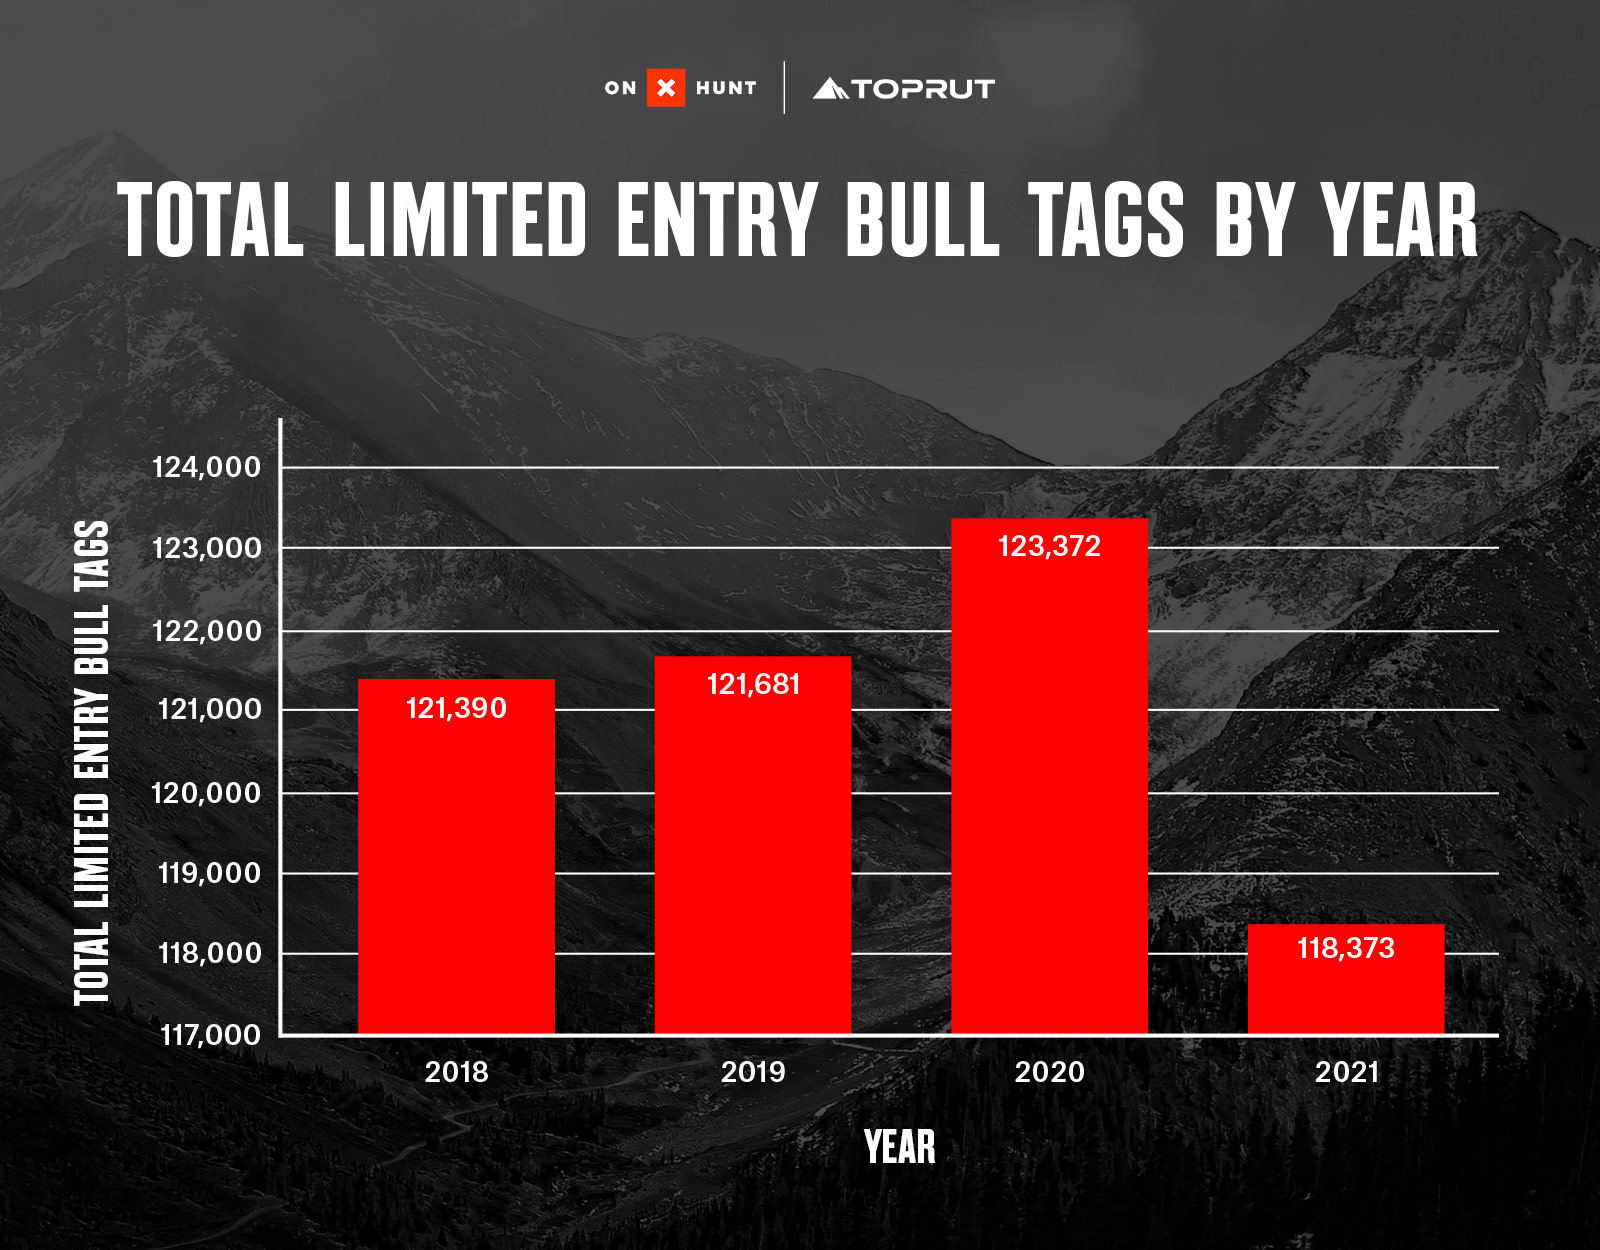
- Total limited entry bull tags are down -2.49% from 2018 to 2021.
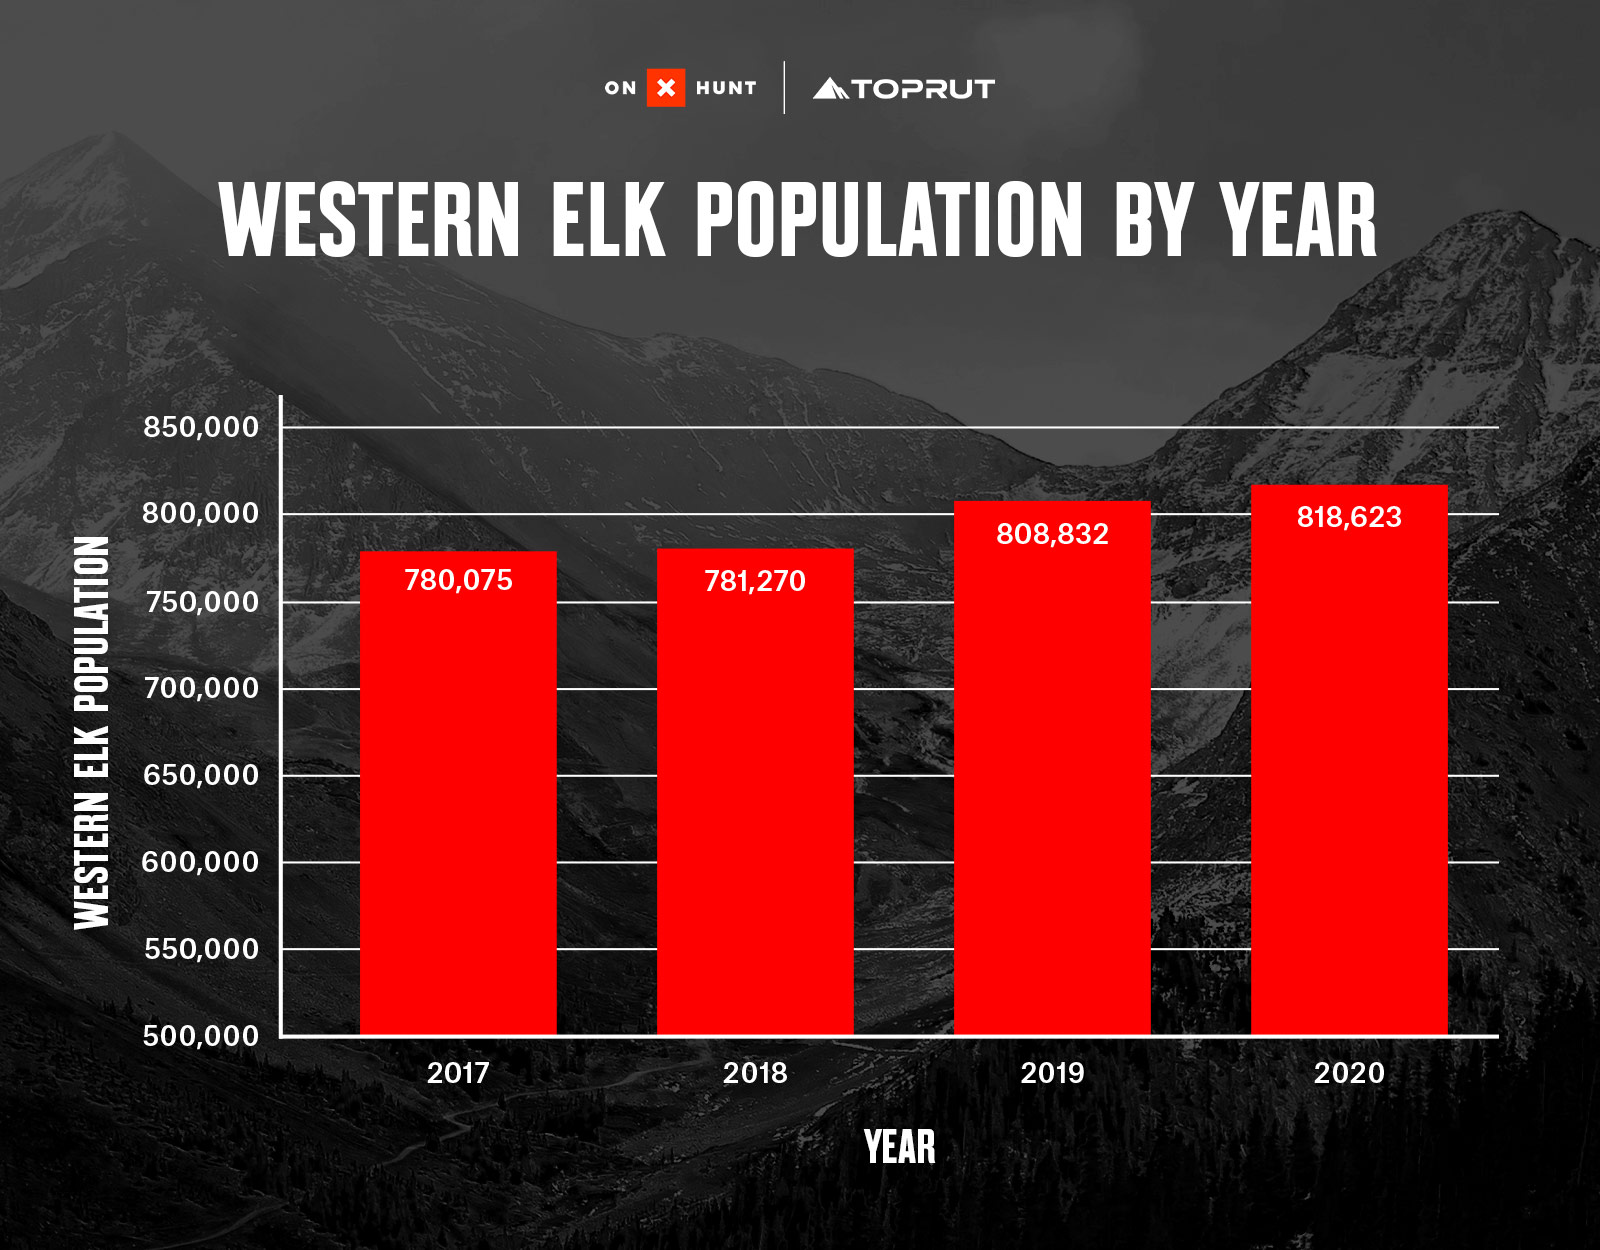
- Western elk population is up +4.94% over the past five years.
From 2018 to 2021, total elk applicants in eight Western states (see methodology section below for details) rose by 11.70%, from 667,094 to 745,124.
If we break this down a bit further to look at resident applicants compared to non-resident applicants, we can see that non-resident applicants are the fastest-growing segment. In the last five years, non-resident applicants across our sample of Western states grew from 184,093 to 225,853, a 22.68% (41,760 applicants) increase.
Resident applicants rose as well during that time period by 9.28%. While they grew at a slower rate than their out-of-state counterparts, they were the main driver of growth: in-state applications rose by 44,831 applicants.
In the same time period, we looked at the total number of limited-entry bull tags that states released and we observed a decrease of -2.49% from 121,390 to 118,373.
Lastly, we took a look at the elk populations in these eight Western states. While total applicants across the sample increased by 11.07%, estimated elk populations only grew by 4.94% (780,075 to 818,623) over the period we had accurate and complete data for (2017 to 2020 — one year offset from the application data). *Elk population data excludes Arizona numbers, as AVGFD does not provide yearly estimates to the public.
Conclusion
As more hunters apply for elk draws throughout the West, the odds of landing a coveted Western elk tag are becoming more challenging.
More hunters are applying from outside their resident states and at the same time resident applicant pools are on the rise. Elk herds are growing, but they are not keeping up with the added demand, and state agencies are lowering the number of limited bull elk tags offered.
As this trend continues, applicants need to have a strategy around the application process. Knowing your odds and understanding where you can hunt are crucial factors for the future of the individual hunter and the hunting industry as a whole.
onX Hunt Elite members have access to Hunt Research Tools, the industry’s premier tool for draw odds and application data. By tapping this resource, hunters can get the most accurate and complete source of information as they navigate draw odds to make educated application decisions.
The good news is it is still possible to find hunting opportunities out West, login to Hunt Research Tools today and own your odds next season.
Data and Methodology
- onX Hunt analyzed a sample of Western draw elk data from 2018 to 2022 from eight primary Western states (Arizona, Colorado, Idaho, Nevada, New Mexico, Montana, Utah, and Wyoming).
- Data was collected directly through onX partnerships with various state wildlife agencies (AZGFD, CPW, NMDGF, MFWP, UDNR, WGFD, NDOW, & IDFG).