
Southern Rut Heat Map
Make your planning, e-scouting, and time in the field as informed and productive as possible with the Southern Rut Layer.
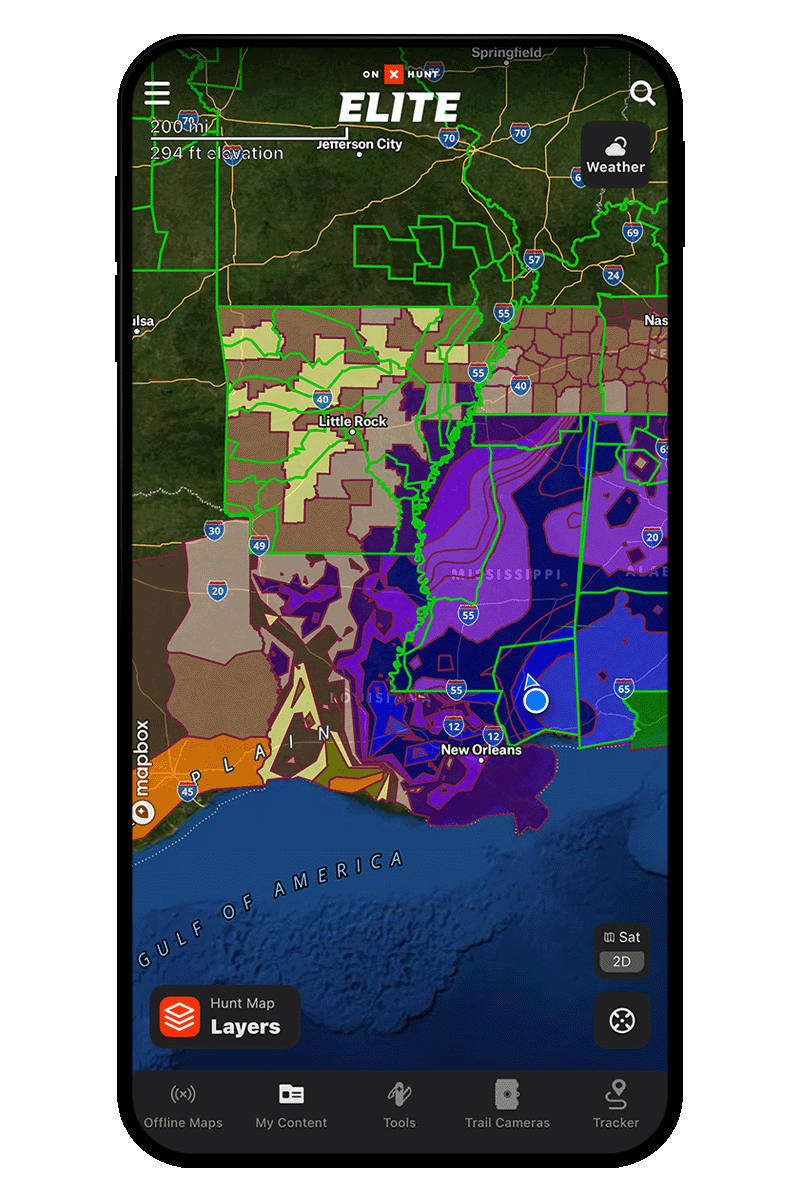
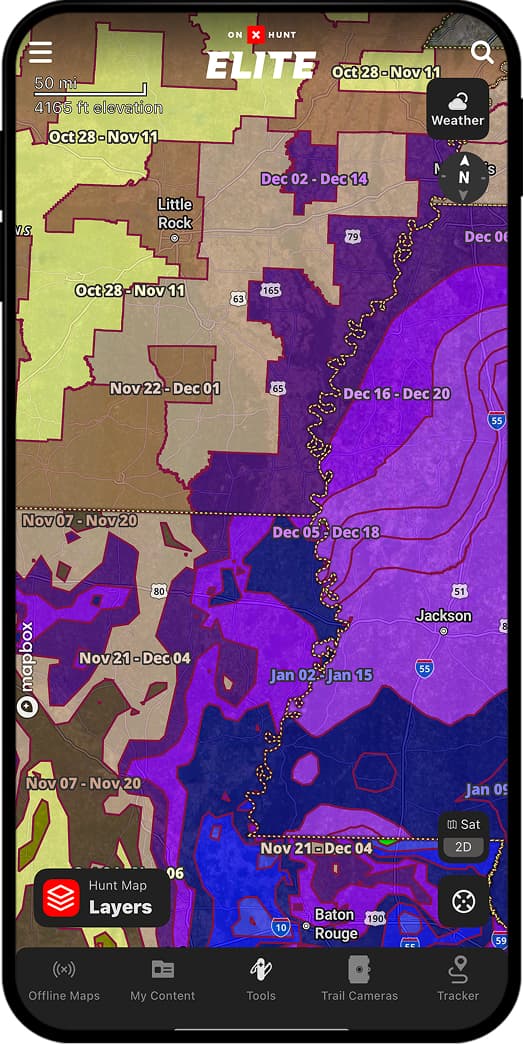
What Is the Southern Rut Heat Map?
In the south, the whitetail rut timing varies from pocket to pocket. Some areas predictably see rut activity the first couple of weeks of November. Other areas? Well, one county might see the rut begin in October while another experiences rutting bucks clear into January.
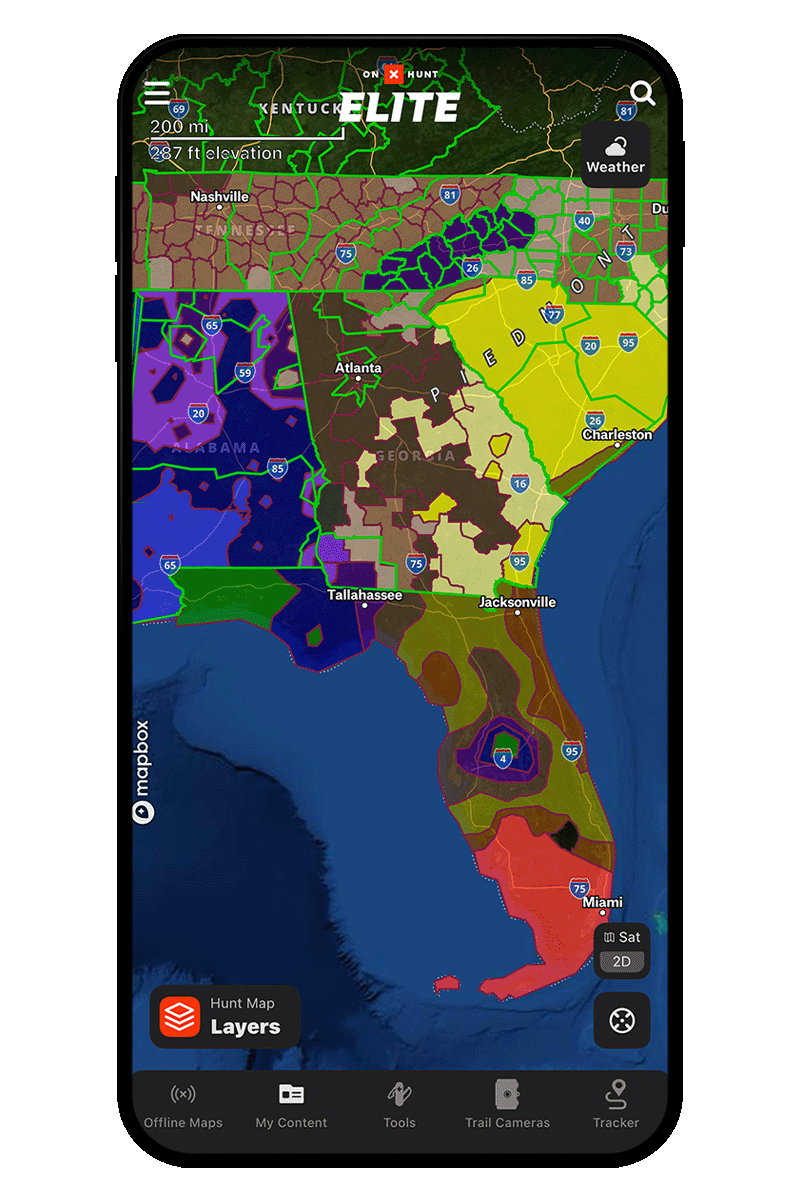
To make your planning, e-scouting, and hunting as productive as possible, we worked with the National Deer Association and state agencies to provide a heat map of southern rut data.

Predict the Rut in Your Neck of the Woods
Being a paying member of onX Hunt gets you access to the Southern Rut Layer Heat Map, featuring the best scientifically backed rut info in the country. We help take the guesswork out of the rut and make it easy to know those special days to be in a tree or box stand.
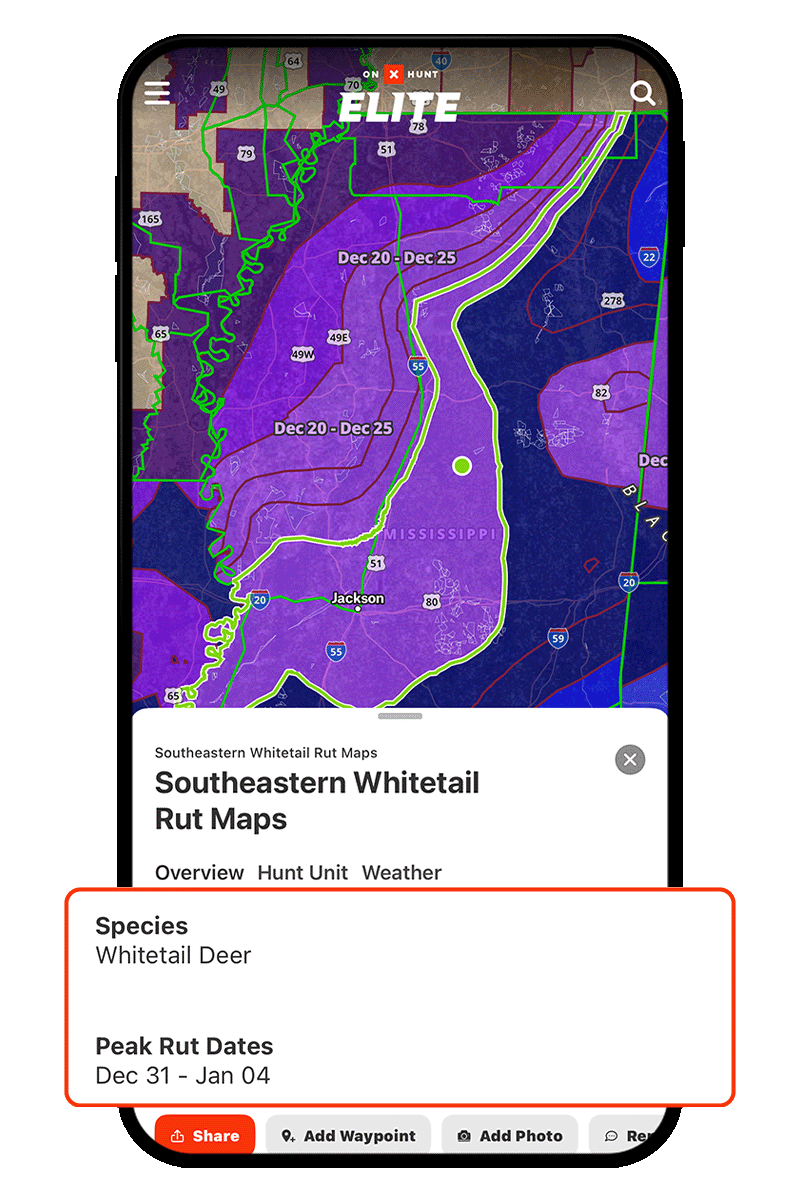
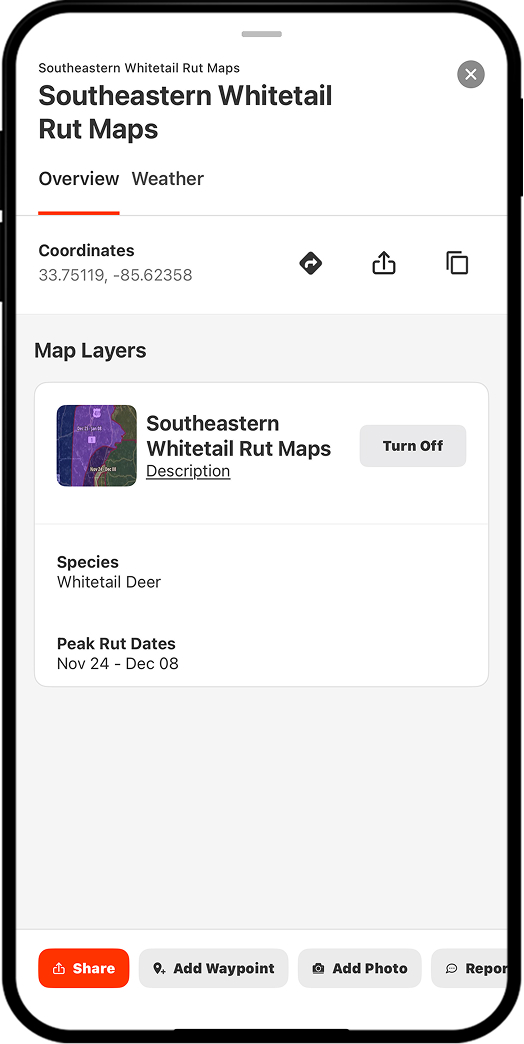
Rather than randomly searching the web for where to go and the best days to be there, use the Southern Rut Layer Heat Map to see where the rut is hot. Then, use other onX Hunt Layers like public/private boundaries, the Topo Basemap, or the Hybrid Basemap (satellite imagery overlaid with topo lines) to do your initial scouting.
With onX Hunt, you can know when to be in a tree and what the weather will be so you can find some likely spots to hang your stand. All that’s left is to mark “Your X” with a Waypoint, put boots on the ground, and make some lasting memories.

Scientific Rut Data From the Source
The Southern Rut Map Layer data comes from state whitetail biologists, wildlife coordinators, and field staff.
Consider this info from the Mississippi Department of Wildlife, Fisheries, and Parks:
“The Wildlife Bureau Technical Staff, with the assistance of a multitude of conservation officers, have been conducting deer health checks at specific sites within Mississippi for more than 20 years. From this information, we have been able to calculate the mean or average breeding date from a multitude of deer populations. We have found breeding dates to vary significantly from one region of the state to another. For example, the average breeding date in extreme SE Mississippi may be five weeks later than in some regions of the Mississippi Delta.”
Some state information represented in the Map Layer is connected to insurance companies.
Why insurance companies? Because when the bucks are cruising and chasing, the insurance claims come rolling in. Biologists have found a correlation between deer-vehicle collisions and the rut. So, whether this map helps you avoid nighttime driving during the rut or fuels your desire to be up before the sun heading to your favorite stand, this is the map for you.
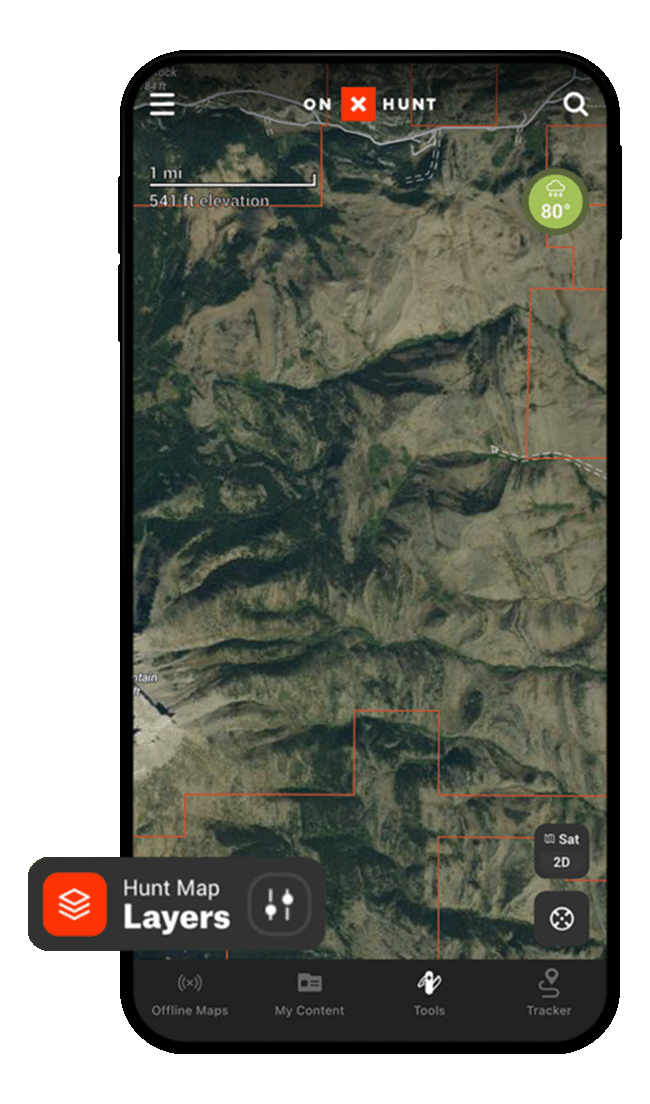
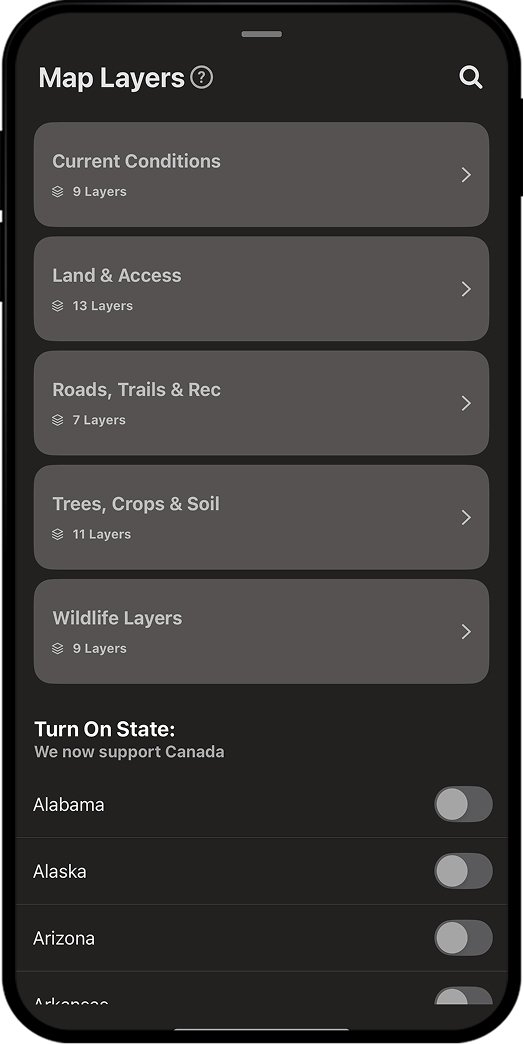
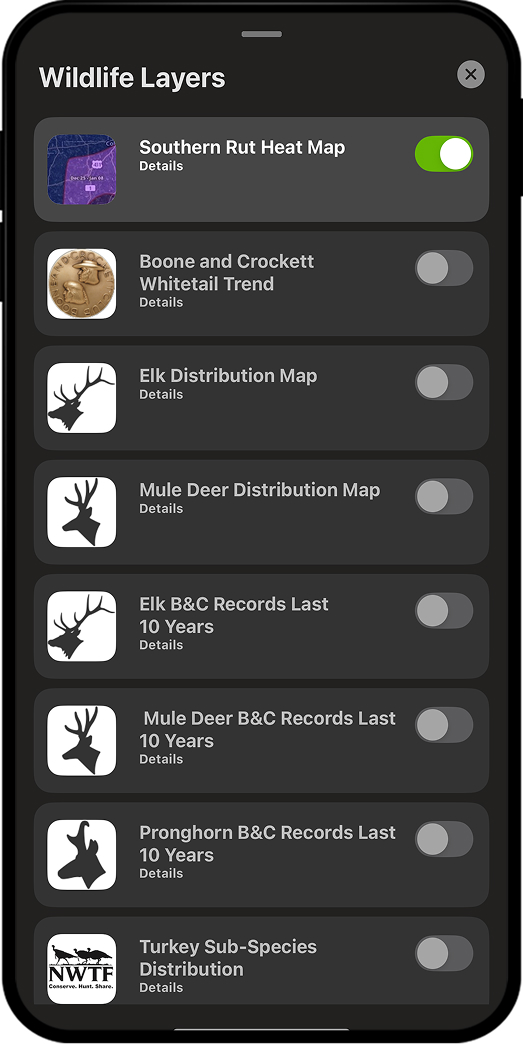
How To Access the onX Southern Rut Heat Map
Get onX Hunt
FAQs
The southern whitetail rut varies widely within each state—and sometimes within individual counties. We want to make the peak rut dates across the region more digestible and more discoverable.
We worked with the National Deer Association and numerous state agencies to gather and input this data. We will continue to expand the Southern Rut Heat Map Layer and add more states as we are able to collect accurate, up-to-date data.