Overview
Has one of the highest numbers of walleye per acre in the state. Good numbers of 1-to 2-pound bass around. Nice perch and crappie. Water straddles the Minnesota/South Dakota border.
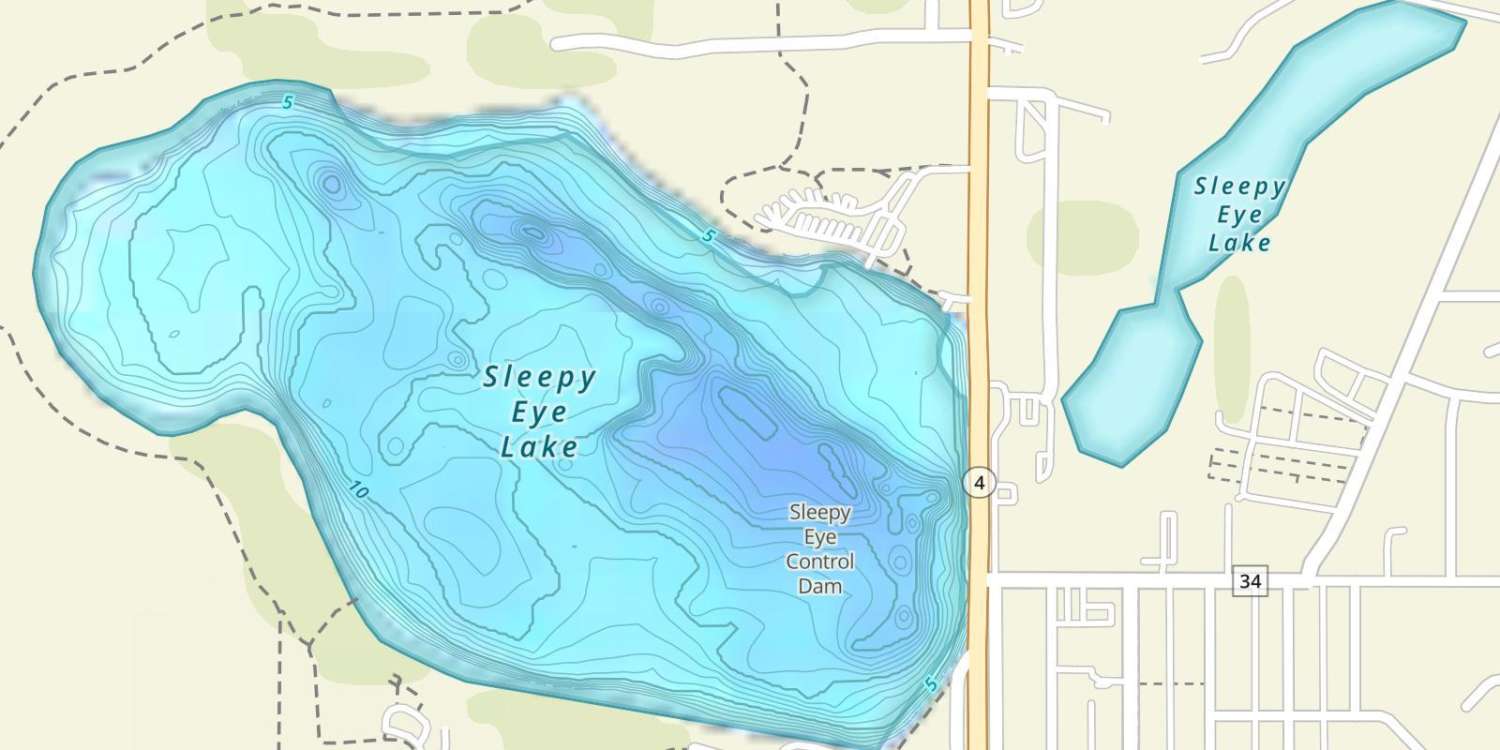
Minnesota River Map
Forage


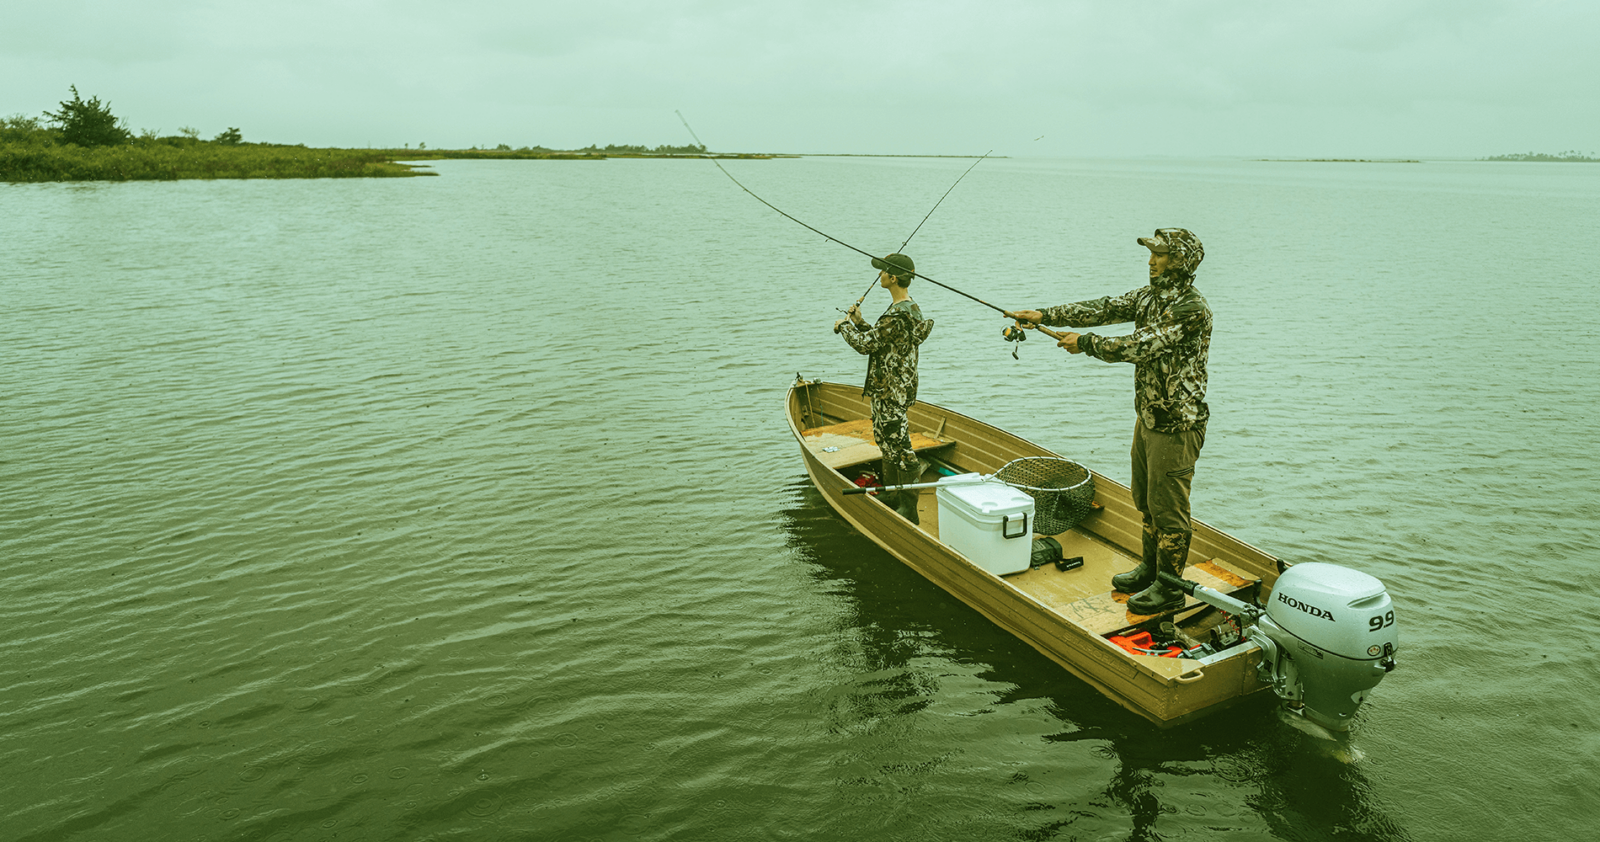
Get Your Line in the Right Water
Quickly find the best places to fish and plan your day right.
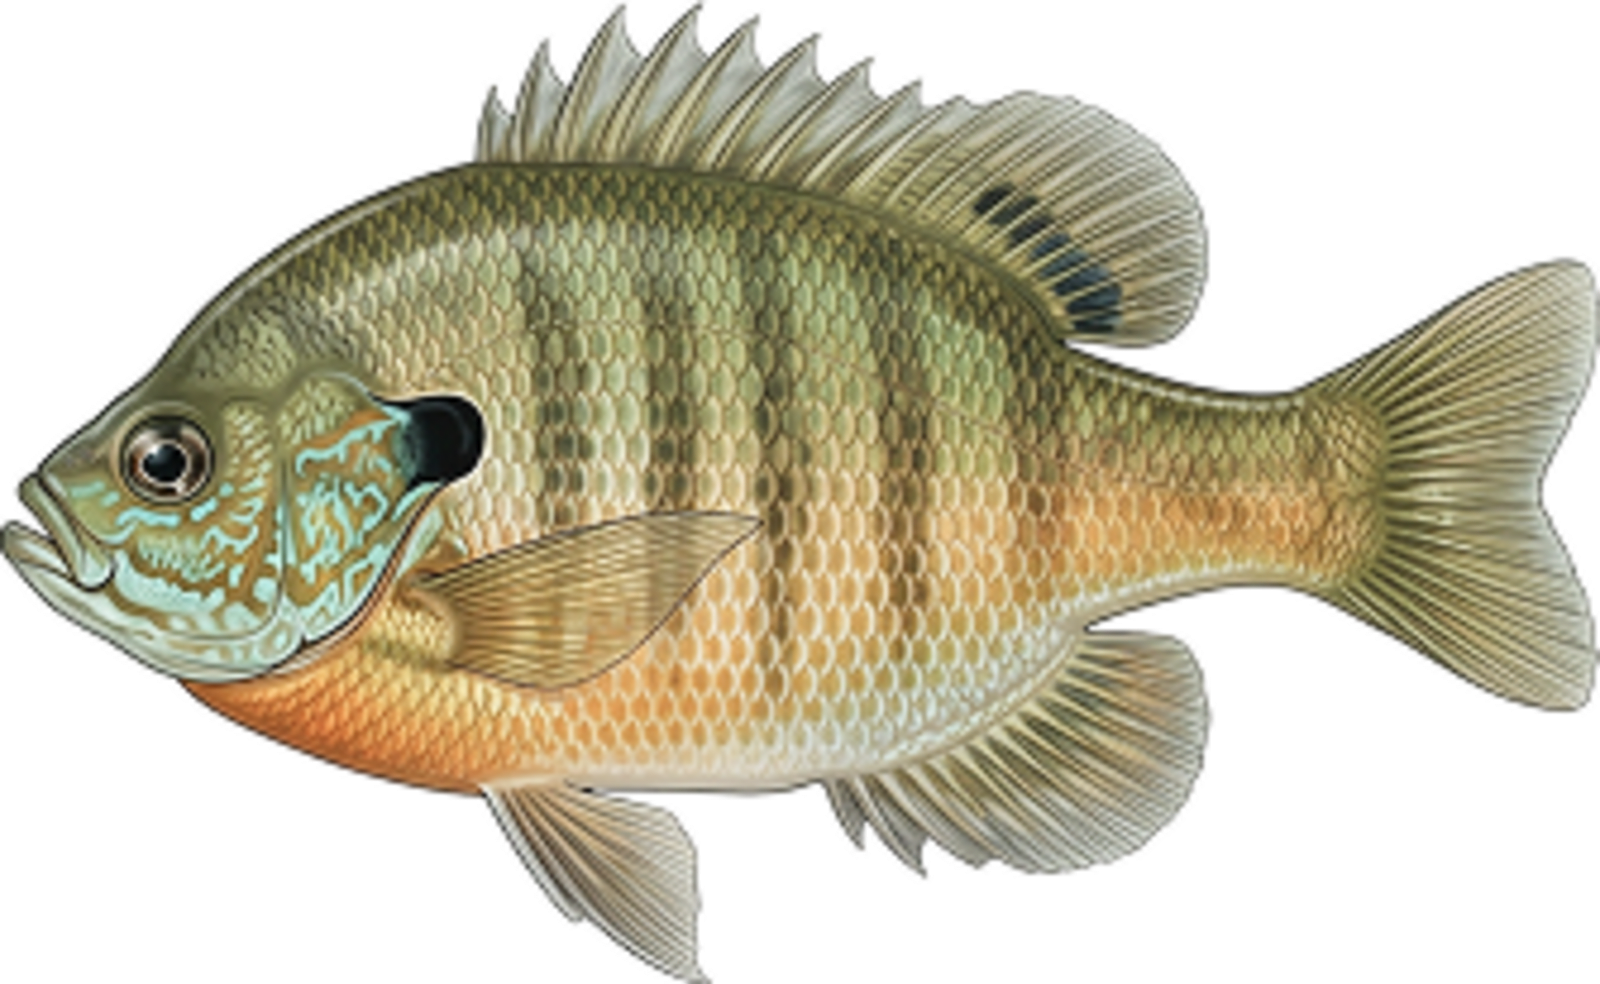
Fish Species

Abundance ratings are based on Catch Per Unit Effort (CPUE) measurements conducted by the MN DNR, and represent a snapshot of a species population at a given point in time.
Source: Minnesota Department of Natural Resources. Survey cadence may vary by state and water body.
Abundance ratings are based on Catch Per Unit Effort (CPUE) measurements conducted by the MN DNR, and represent a snapshot of a species population at a given point in time.
Source: Minnesota Department of Natural Resources. Survey cadence may vary by state and water body.
Abundance ratings are based on Catch Per Unit Effort (CPUE) measurements conducted by the MN DNR, and represent a snapshot of a species population at a given point in time.
Source: Minnesota Department of Natural Resources. Survey cadence may vary by state and water body.
Abundance ratings are based on Catch Per Unit Effort (CPUE) measurements conducted by the MN DNR, and represent a snapshot of a species population at a given point in time.
Source: Minnesota Department of Natural Resources. Survey cadence may vary by state and water body.
Abundance ratings are based on Catch Per Unit Effort (CPUE) measurements conducted by the MN DNR, and represent a snapshot of a species population at a given point in time.
Source: Minnesota Department of Natural Resources. Survey cadence may vary by state and water body.
Abundance ratings are based on Catch Per Unit Effort (CPUE) measurements conducted by the MN DNR, and represent a snapshot of a species population at a given point in time.
Source: Minnesota Department of Natural Resources. Survey cadence may vary by state and water body.
Abundance ratings are based on Catch Per Unit Effort (CPUE) measurements conducted by the MN DNR, and represent a snapshot of a species population at a given point in time.
Source: Minnesota Department of Natural Resources. Survey cadence may vary by state and water body.
Abundance ratings are based on Catch Per Unit Effort (CPUE) measurements conducted by the MN DNR, and represent a snapshot of a species population at a given point in time.
Source: Minnesota Department of Natural Resources. Survey cadence may vary by state and water body.
Abundance ratings are based on Catch Per Unit Effort (CPUE) measurements conducted by the MN DNR, and represent a snapshot of a species population at a given point in time.
Source: Minnesota Department of Natural Resources. Survey cadence may vary by state and water body.
Abundance ratings are based on Catch Per Unit Effort (CPUE) measurements conducted by the MN DNR, and represent a snapshot of a species population at a given point in time.
Source: Minnesota Department of Natural Resources. Survey cadence may vary by state and water body.
Abundance ratings are based on Catch Per Unit Effort (CPUE) measurements conducted by the MN DNR, and represent a snapshot of a species population at a given point in time.
Source: Minnesota Department of Natural Resources. Survey cadence may vary by state and water body.
Abundance ratings are based on Catch Per Unit Effort (CPUE) measurements conducted by the MN DNR, and represent a snapshot of a species population at a given point in time.
Source: Minnesota Department of Natural Resources. Survey cadence may vary by state and water body.
Abundance ratings are based on Catch Per Unit Effort (CPUE) measurements conducted by the MN DNR, and represent a snapshot of a species population at a given point in time.
Source: Minnesota Department of Natural Resources. Survey cadence may vary by state and water body.


