Size
49,545ac
Boat Launch
Carry-in Launch
Toilet
Yes
Boat Dock
Species in Harry S Truman Reservoir
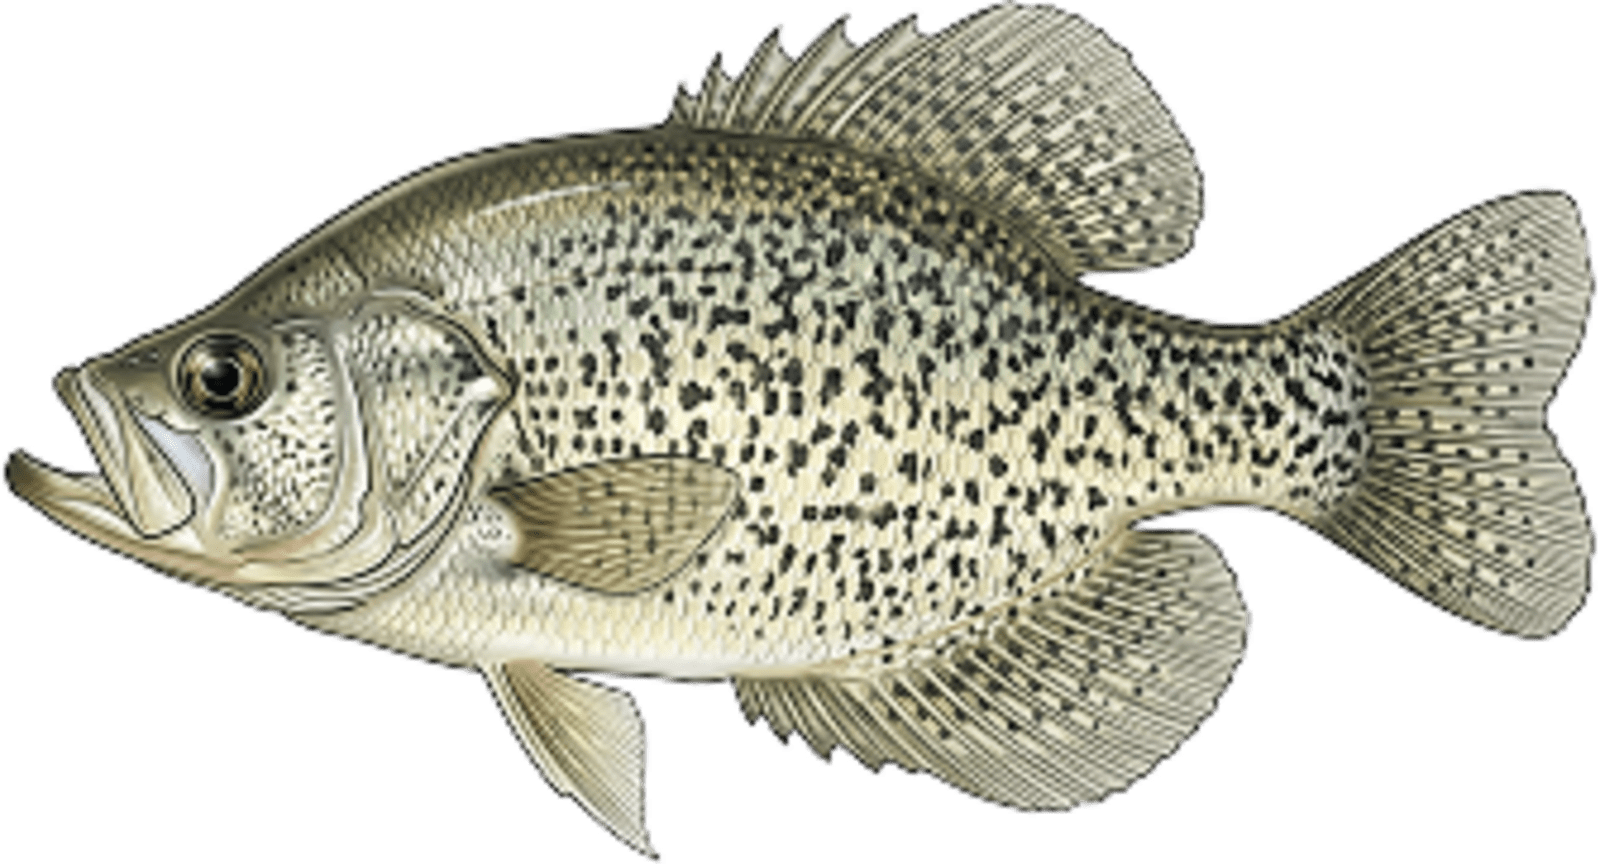
Crappie
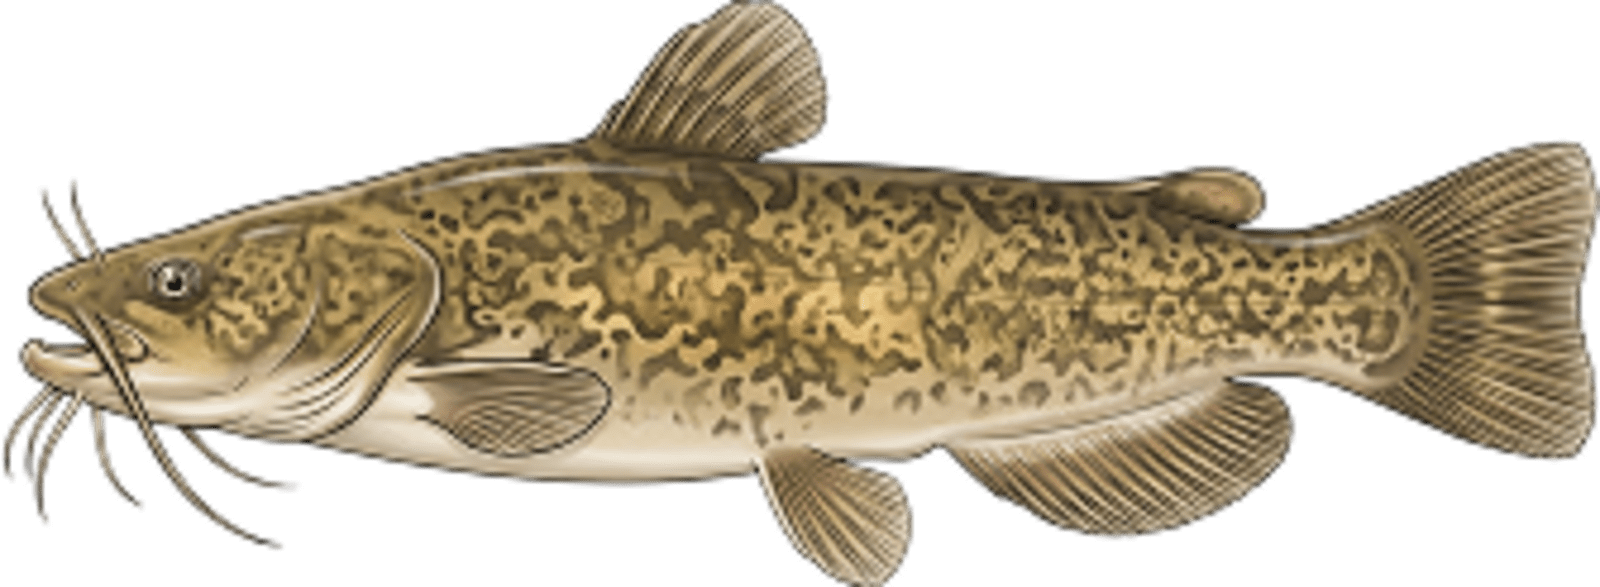
Flathead catfish
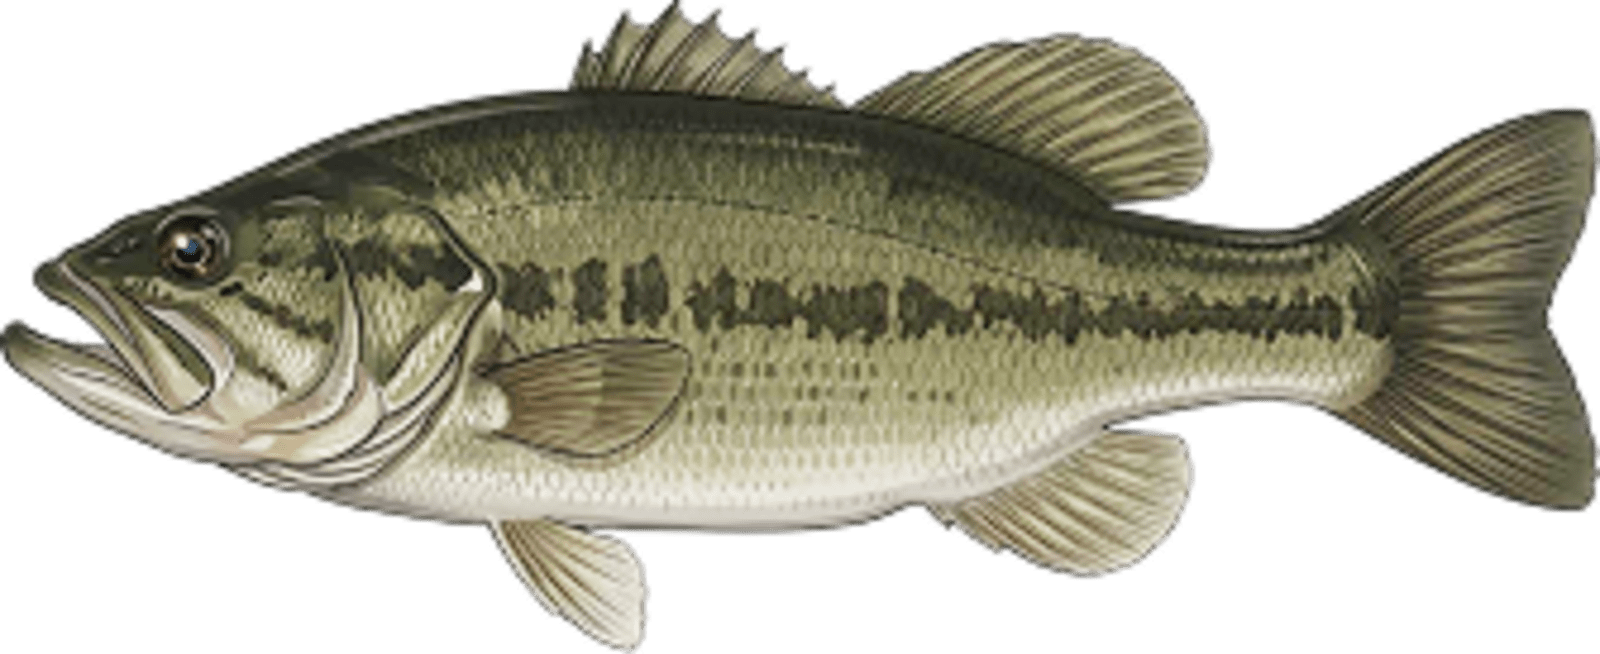
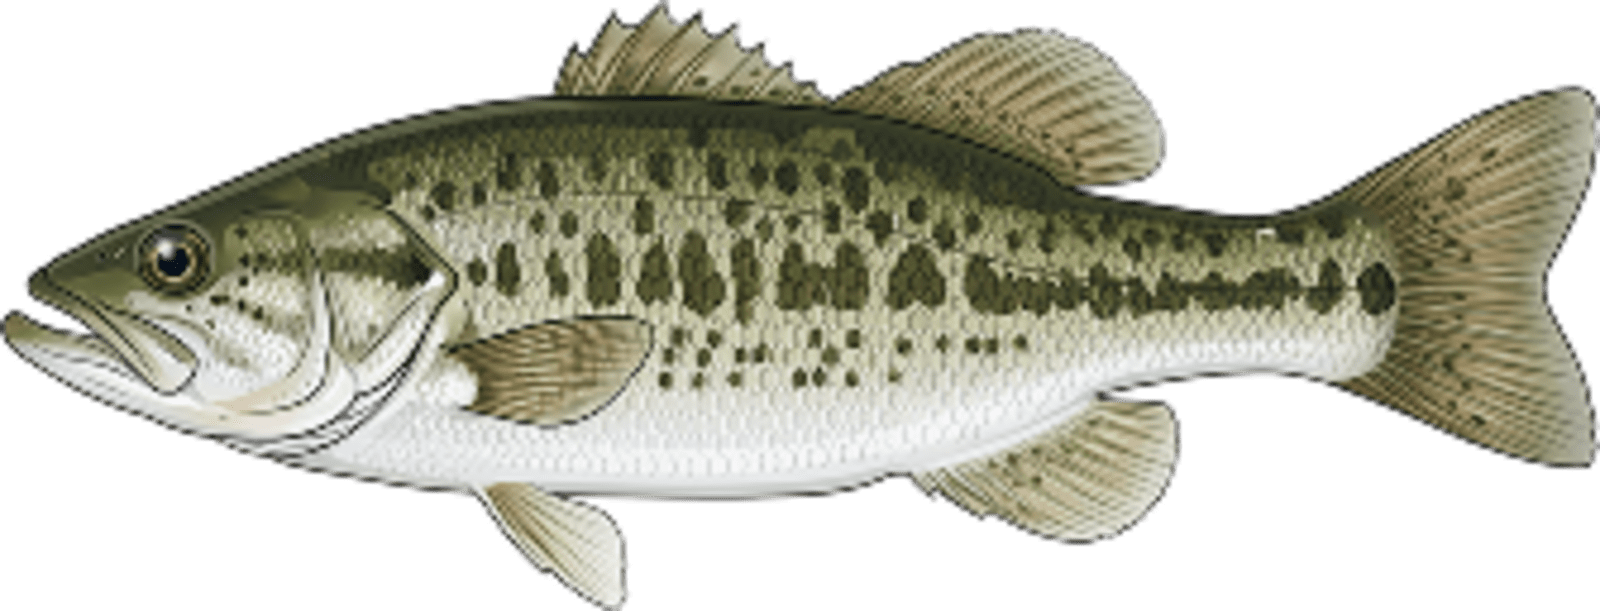
Largemouth bass
Spotted bass
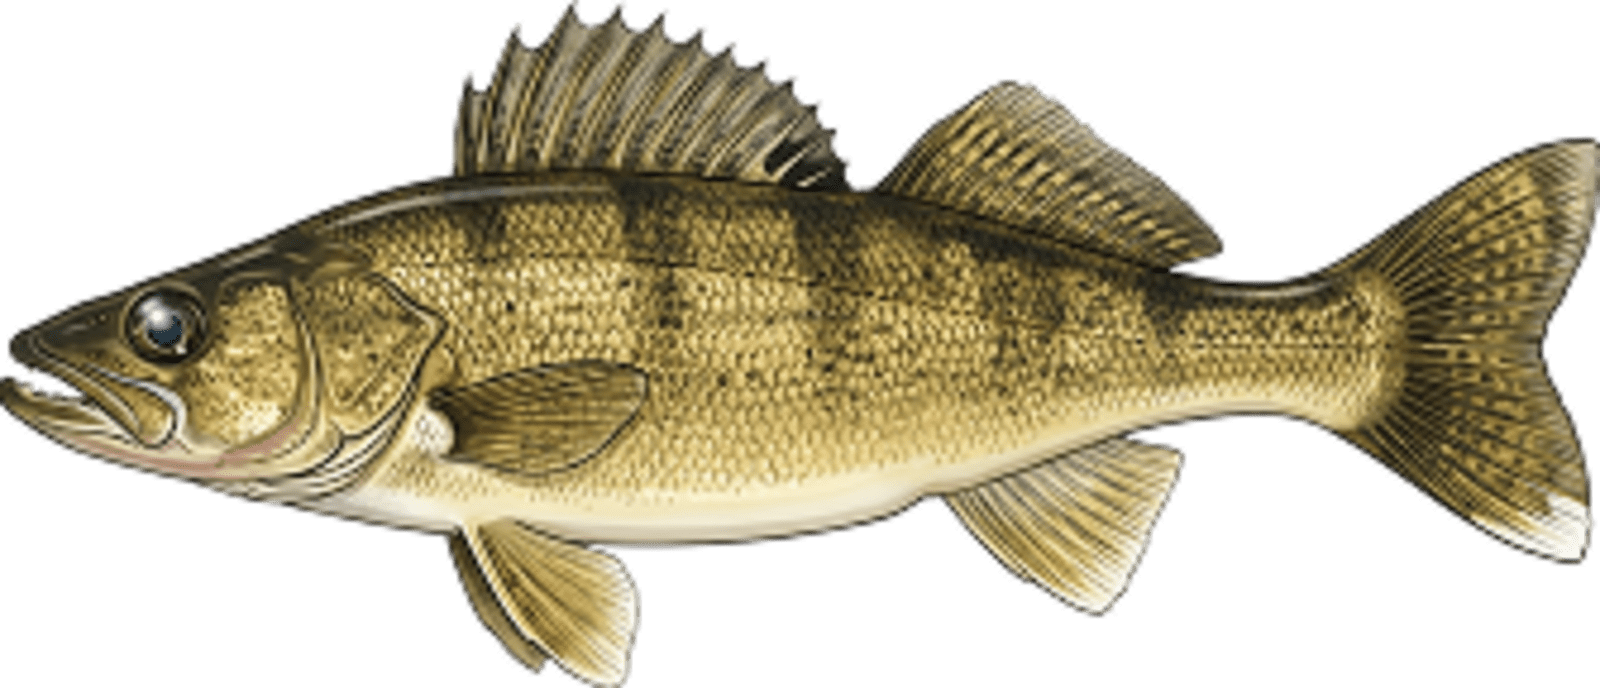
Walleye
Blue catfish
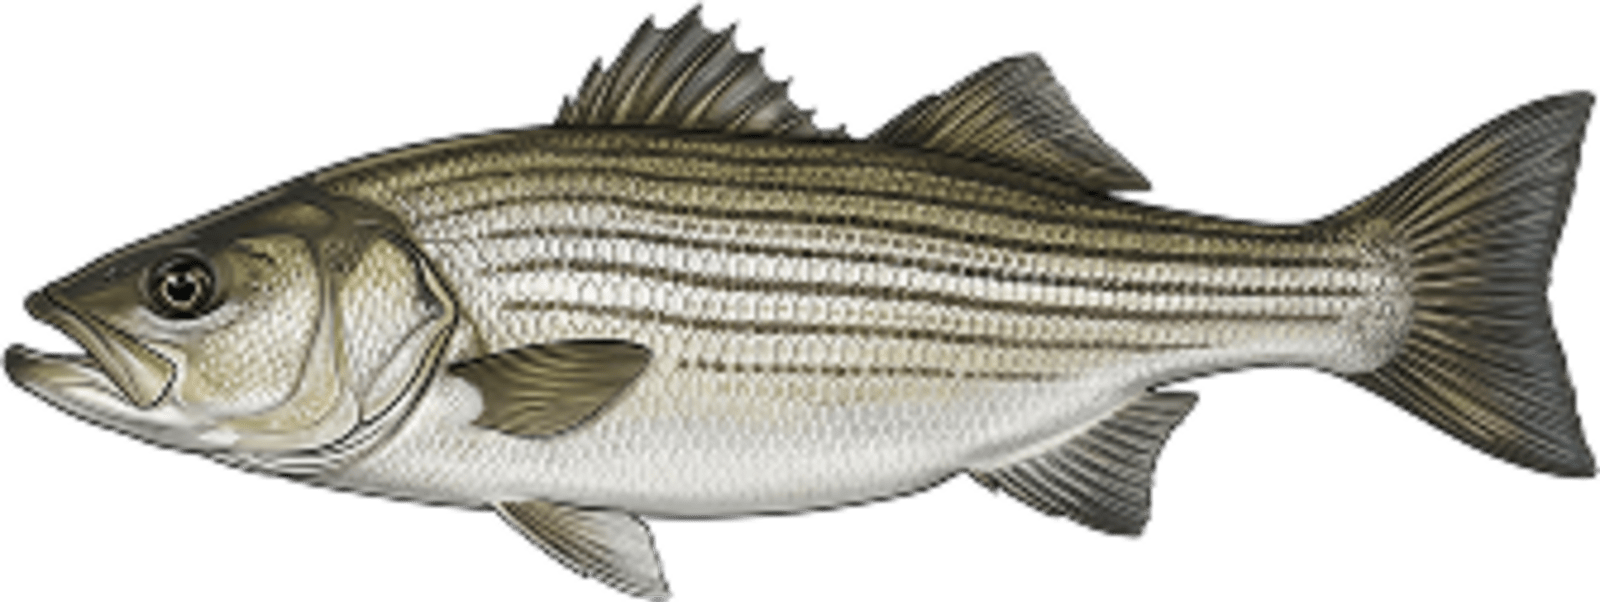
Striped Bass
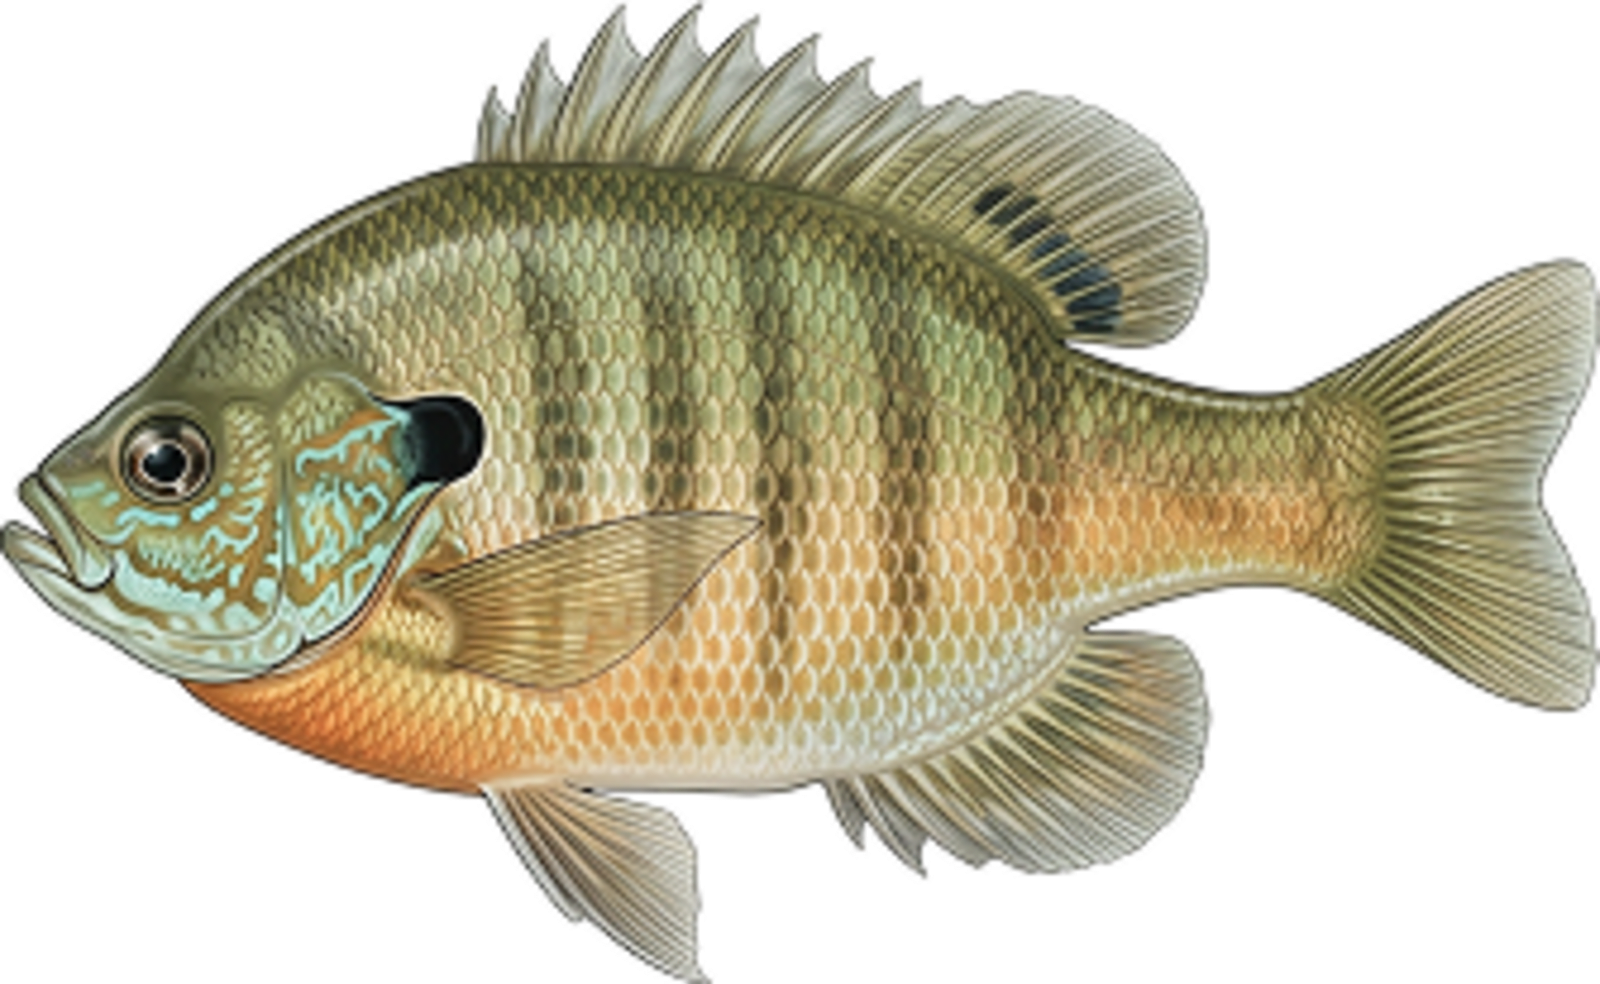
Bluegill
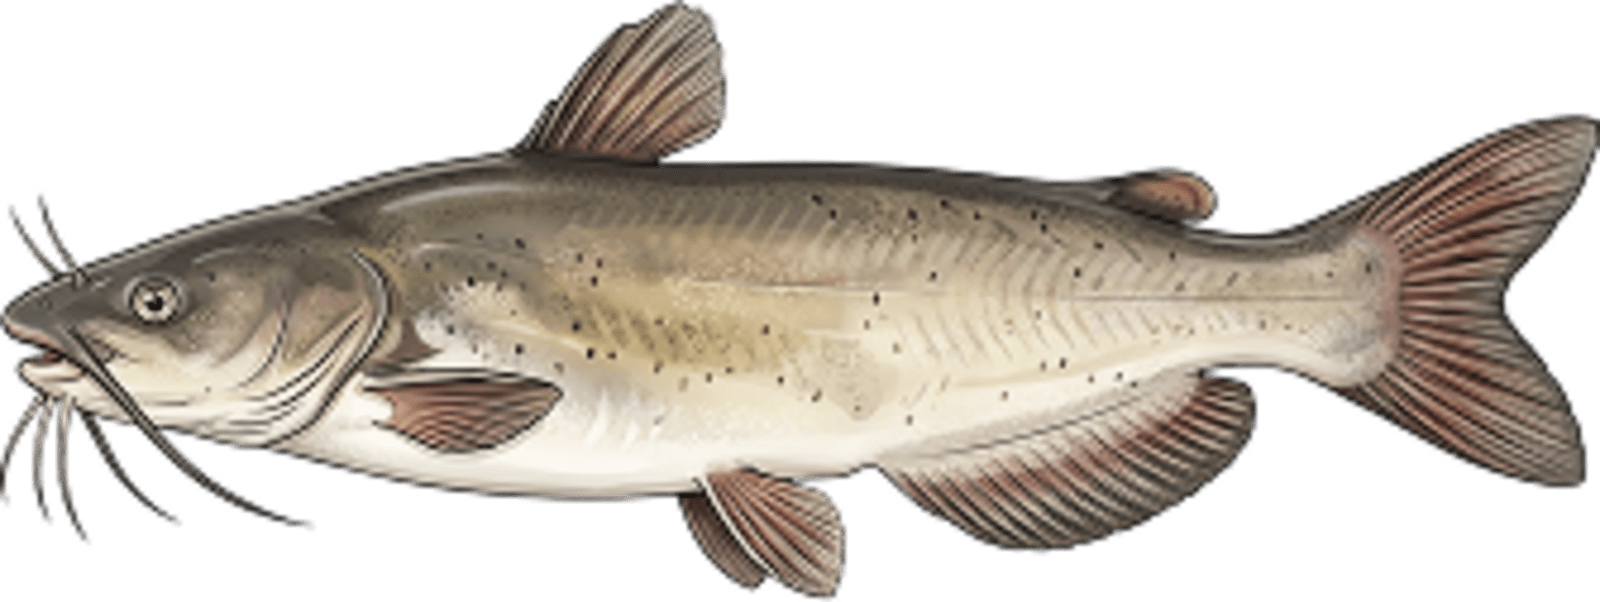
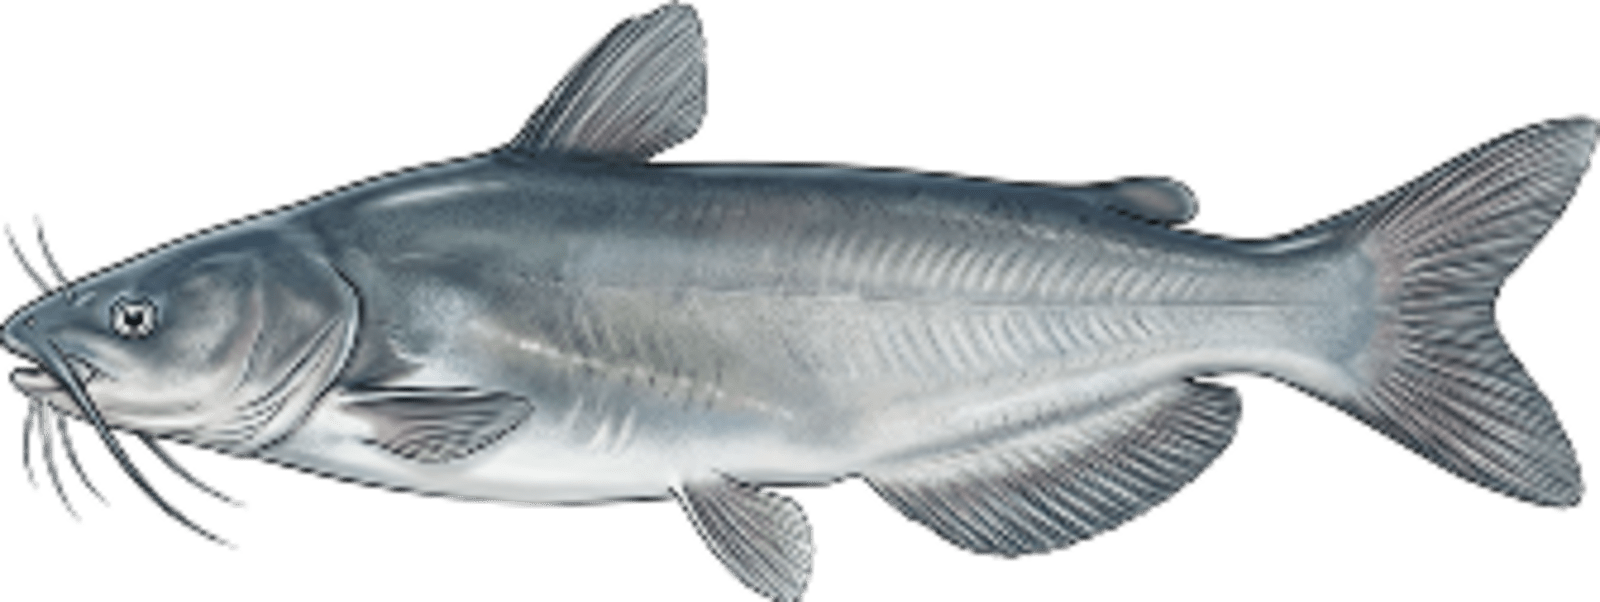
Channel catfish
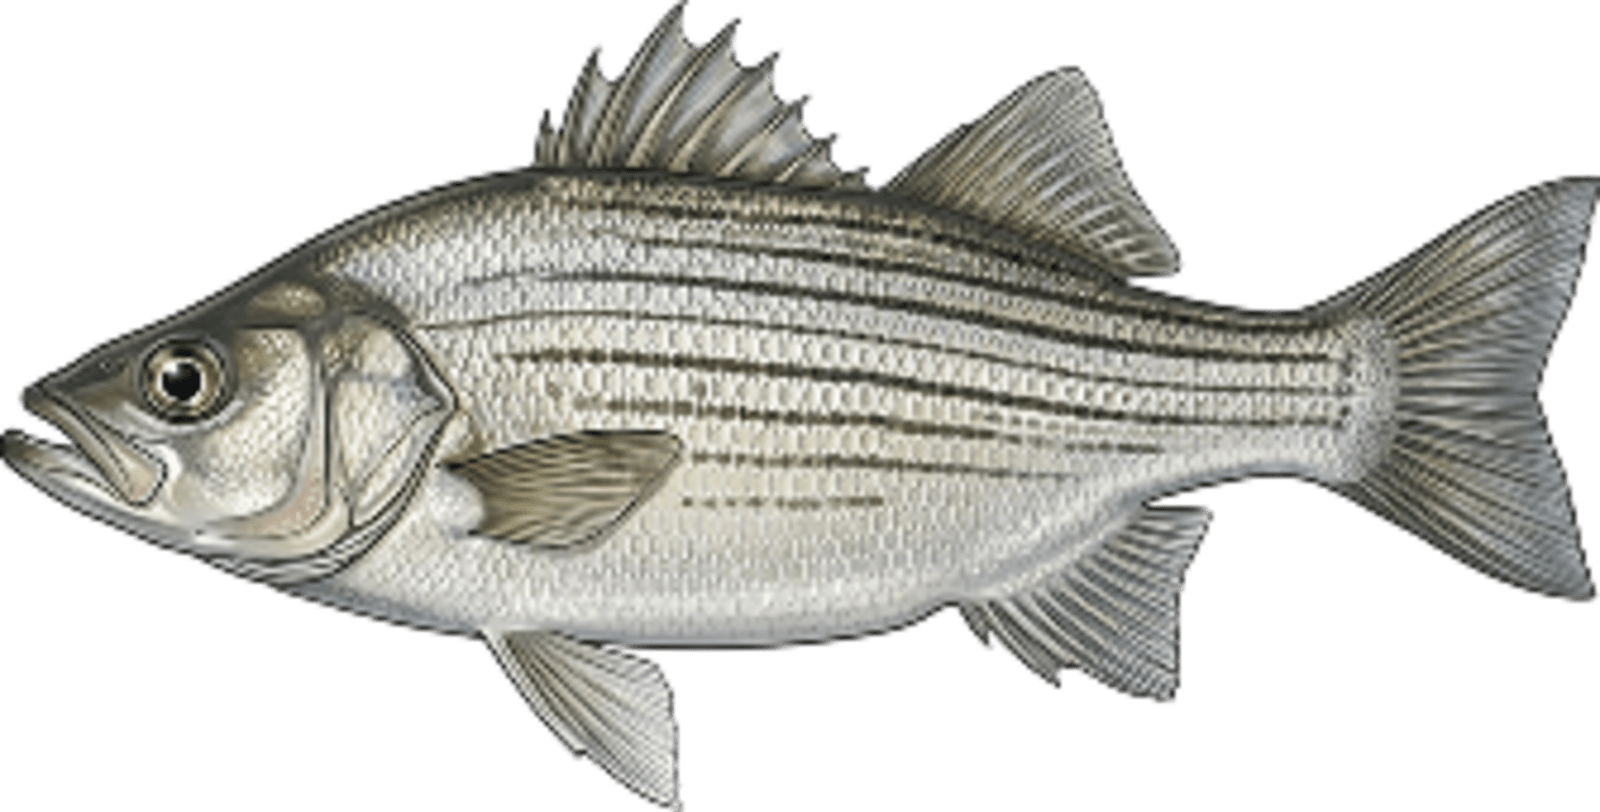
White bass
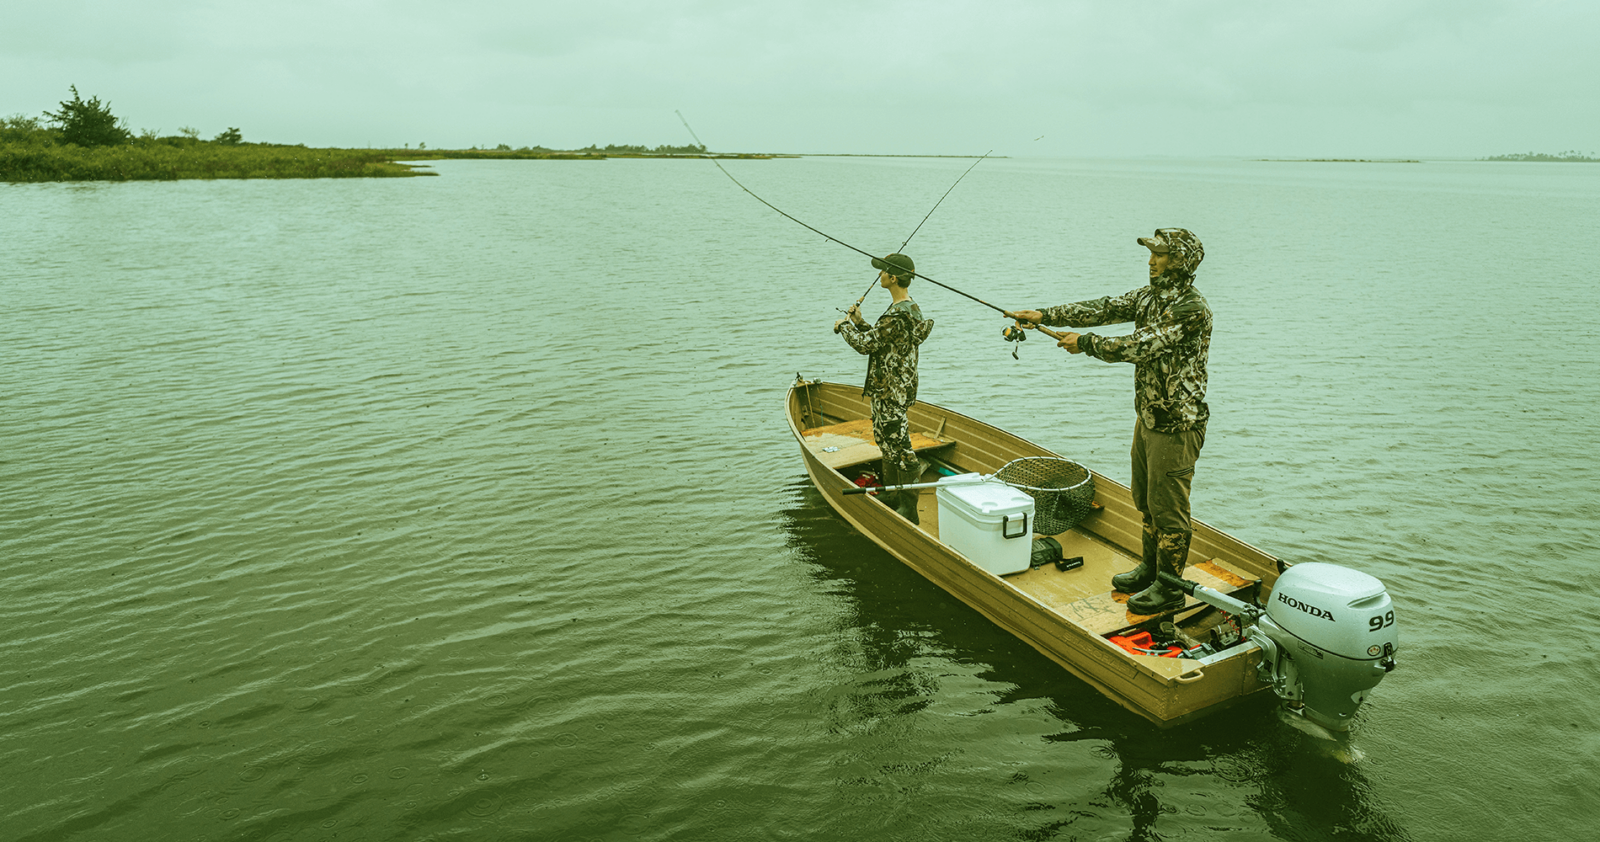
Overview
More than 150,000 acres of public land surrounds the lake and offers excellent recreational opportunities including hiking, horseback riding and hunting. Oh yeah, the fishing's great too! 55,600 acres
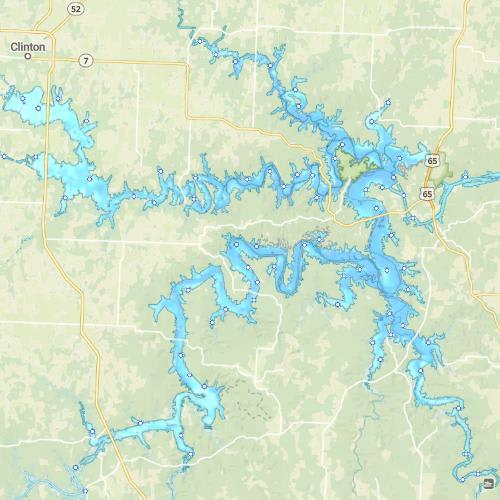
Harry S Truman Reservoir Map
Features
Truman Reservoir was formed in 1979 with the completion of the Harry S. Truman Dam, which impounded the Osage River. Initially planned to provide much-needed flood control to the region, the dam also generates electricity. Unlike it’s next-door neighbor, Lake of the Ozarks, the vast majority of the reservoir remains undeveloped, natural forest. This rustic setting may be one of the reasons that Truman has become one of the most popular angling destinations in Missouri.
The reservoir boasts strong fisheries for several species. Among the most popular targets for anglers are largemouth bass, crappie, catfish, walleye and hybrid striped bass, though other fish receive good pressure as well. One interesting aspect of the reservoir is its paddlefish population, which creates a relatively rare opportunity for anglers to snag this large, pre-historic fish.
Forage
In the main basin, gizzard shad, brook silversides, various minnows and miscellaneous bluegill/sunfish comprise the bulk of the forage base, along with young-of-the-year of all species, though crayfish are also available in the creeks that flow into the reservoir.
Seasonal Movements
In late winter and early spring, the black bass species relate to main-reservoir and secondary points. Once the water warms, bass spawn in the backs of coves and the warmer creeks on the upper end of the reservoir. Further increases in water temperature drive bass to the deeper water on the main basin, though they return to the coves and creeks as temperatures drop in fall.
In spring, crappie head into the tributaries in the upper end of the reservoir to shallow, gravel slopes. Summer water temperatures encourage them to head back to the lower end of the reservoir, eventually moving onto stump-covered flats. In fall, crappie begin to transition toward bluffs and creek channels, holding near timber. As temperatures continue to fall and winter comes, crappie school near steep points and bluffs, remaining close to timber. Still, some crappie can be caught in shallow water, even in the cold of winter.
White bass and hybrids perform similar seasonal movements. Generally, both species go on a spawning run in Truman’s larger tributaries in April and May, though this run can happen in March if temperatures permit it. After the spawn, hybrids and white bass head to the lower reservoir where they relate to humps and points through summer. In fall, they move toward the surface to feed on schools of shad that form at this time. Usually, these schools move windward to shallow points. Hybrids and white bass follow the schools through winter as well, staying close by as the shad move to the warm water provided by the larger creeks.
In early spring, walleye head into the upper-reservoir tributaries for their spawning run, returning to the lower reservoir by the tail end of spring. As temperatures rise, they move to the humps and points off the main basin.
![]()
Get Your Line in the Right Water
Quickly find the best places to fish and plan your day right.
Top Fish Species
Crappie
5-15 in
Length Range
8 in
Length Range
2025
Surveyed
Abundance (CPUE)

Understanding Abundance
Abundance ratings are based on Catch Per Unit Effort (CPUE) measurements conducted by the MN DNR, and represent a snapshot of a species population at a given point in time
Source: Minnesota Department of Natural Resources. Survey cadence may vary by state and water body.Species Lengths
2025
Dec
2026
Jan